THE
COLLAPSE OF US NEOLIBERAL ECONOMY IS
REAL
THE ECONOMY IS AT ZERO & IT WON’T GO UP
WE NEED
A POST-NEOLIBERAL AGENDA
WE NEED SOCIALISM WHERE PRODUCTIVE
CAPITAL
AND
LABOR WORK & GROWTH HAND ON HAND
READ THIS:
History is pretty clear about future outcomes from the Fed’s current
actions. More
importantly, these actions are coming at a time where there werealready tremendous headwinds plaguing future
economic growth...
The Fed is now permanently stuck at zero.
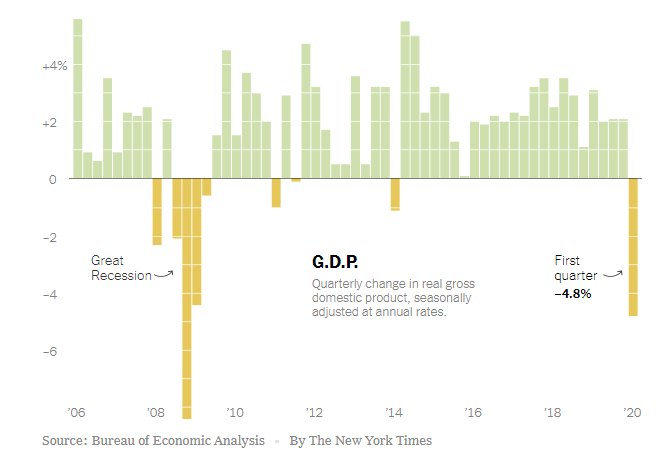
The negative 4.8% decline in GDP in the first quarter was
stunning. Importantly, that reading only encapsulated the impact of the
economic “shutdown” in that last two weeks of the quarter.
This suggests, considering the entire month of April (1/3rd of the quarter) was
a wash, the numbers will worse next quarter.
See Chart: GDP
The economy will eventually
bounce back, it may take longer than the White House, and many investors
expect.
There
are several reasons for this assumption.
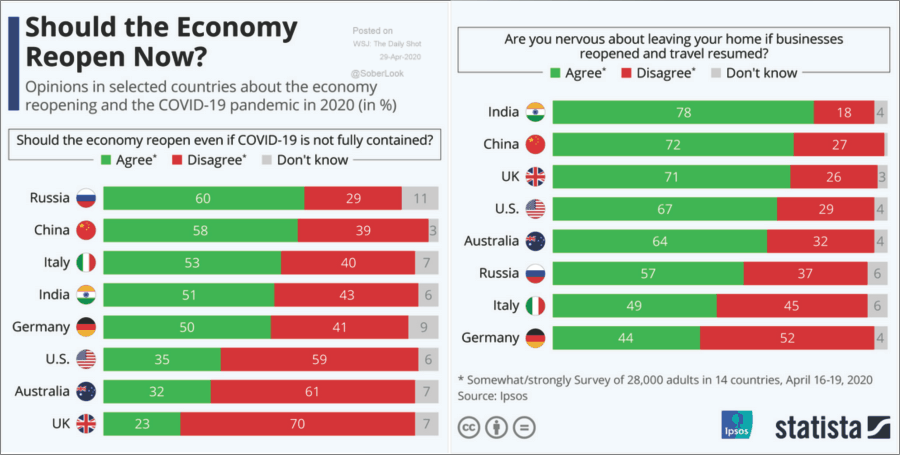
Initially, even with the
economy open, it is UNLIKELY [that GDP growth up] even without job losses,
individuals will immediately return to old routines [of debt & open doors to recession]. A survey by Statista
encapsulated this view.
See Charts:
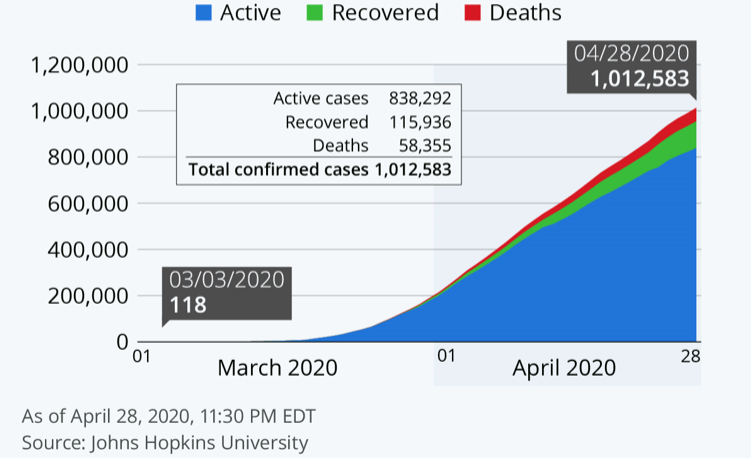
It is
even harder to expect such activities to immediately occur when there is no
decline in virus cases currently. While the rate of increase may be slowing,
the concerns of infection will likely slow activity.
See Chart:
Even if Steve Mnuchin is
correct and activity does come back, a likely second
wave of the virus in the fall could be worse than the first. While I doubt a “re-shuttering” of
the economy will occur, the psychological impact would likely cripple the
recovery further.
See Chart:
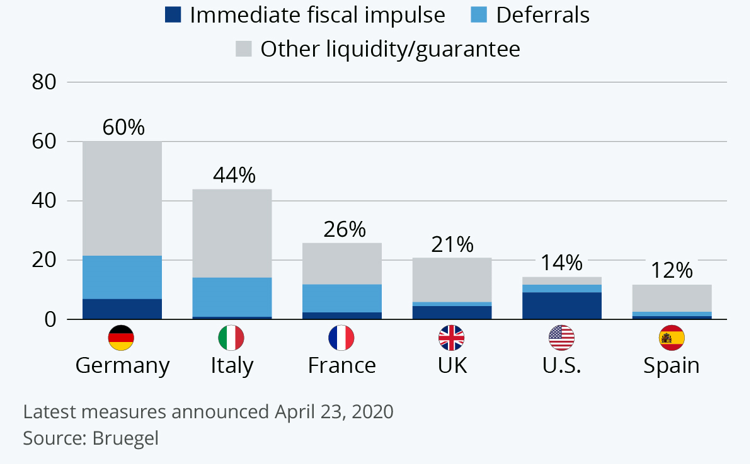
Let’s
make some basic assumptions about the impact to the overall economy.
- Total inflation-adjusted GDP = $18.987 Trillion
- Median real incomes: $63,179
- 50 Million job losses x 50,000 = $3.16 Trillion
- Current bailouts at 14% of GDP = $2.6 Trillion
See Chart:
Effectively, the current fiscal
stimulus is a wash relative to the impact on the economy. The more prolonged unemployment remains, the more likely
consumption will constrict.
NO ECONOMIC SWOOSH
What this suggests is that
hopes for a “V-shaped” recovery could be misguided. If our
expectations of a slow re-engagement with the economy play out, the employment
recovery will be slow also. As fiscal stimulus plays out, economic growth will
struggle to gain traction.
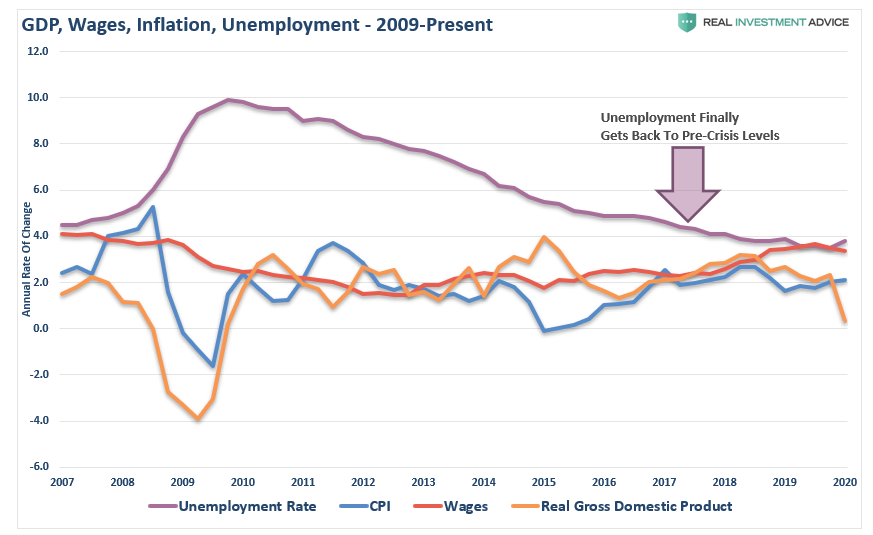
Ironically,
this is precisely what we witnessed post the “Financial Crisis” in
2008. The chart below shows the recovery of GDP, employment, wages, and
inflation.
See Chart:
Evolut
of GDP, Wages, Inflation, Unemployment since 2009
https://www.zerohedge.com/s3/files/inline-images/Unemployment-Wages-GDP-CPI-042920.png?itok=Uoc8MUPw
While employment took nearly a
decade to recover to pre-crisis lows, wages, GDP, and inflation failed to gain
traction.
Such
was despite a decade of zero-interest-rate policy by the Fed, unprecedented
monetary interventions, and a massive surge in consumer debt.
See Chart:
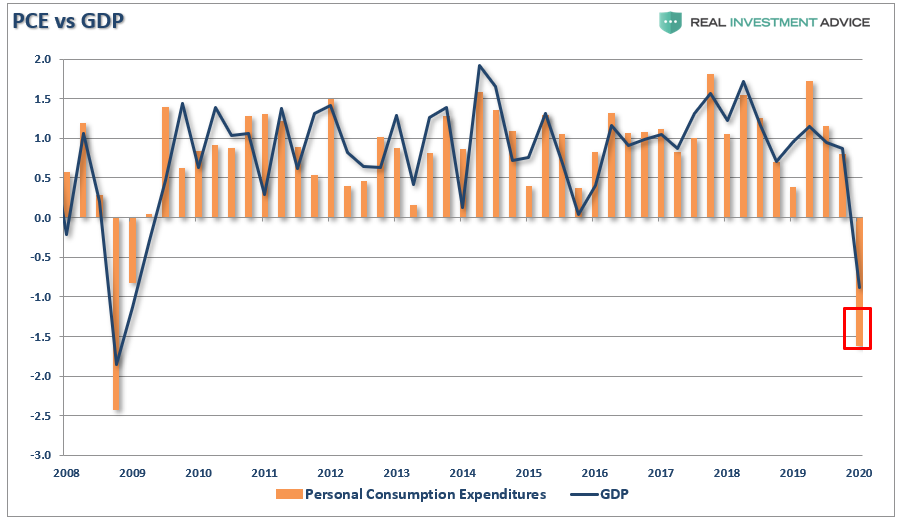
No Money, More Problems
The problem with a sharp loss
of employment is that it creates a negative feedback loop into the economy. As
job losses mount, incomes fall, which reduces personal consumption expenditures
(PCE).
This
past week PCE plunged as job losses surged. Importantly, this decline occurred
in just the last two weeks of March. Given the entire month of April was
shutdown, next quarter’s PCE report will be markedly worse.
See Chart:
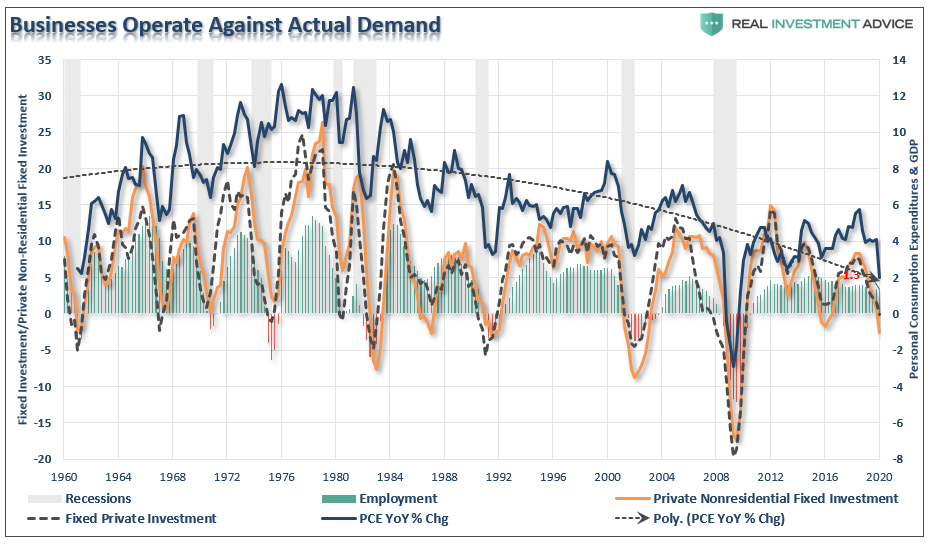
BUSINESS
OPERATE AGST ACTUAL DEMAND
PCE a tells us there will be a slow recovery in the economy.
There
is a negative feedback loop between employment and consumption. As
unemployment rises, consumption falls due to a lack of
income. Since businesses operate based on demand for goods and services, the
correlation between PCE, fixed investment, and employment are high.
See Chart:
Despite the reopening of the
economy, businesses will not immediately return to full operational activity,
until consumption returns to more normal levels. Such a recovery is likely
going to frustrate policy-makers and the Fed.
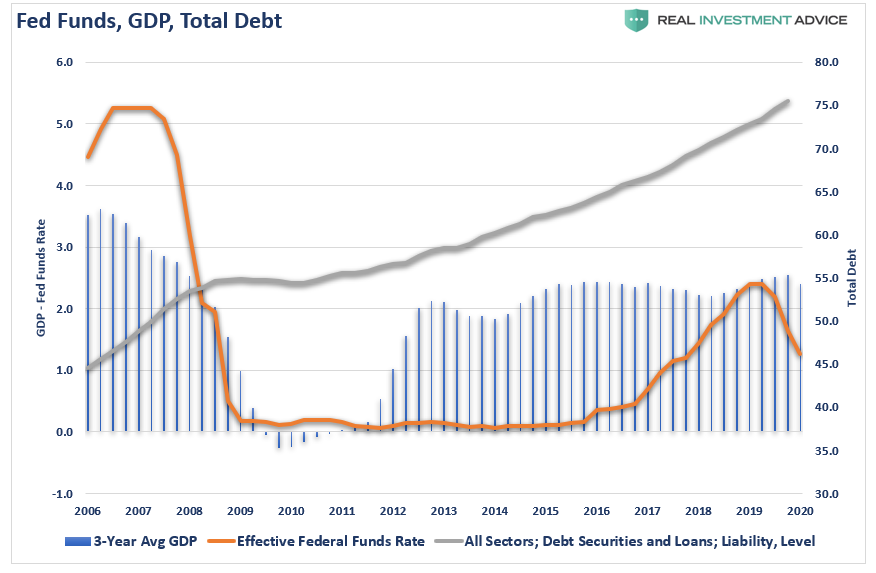
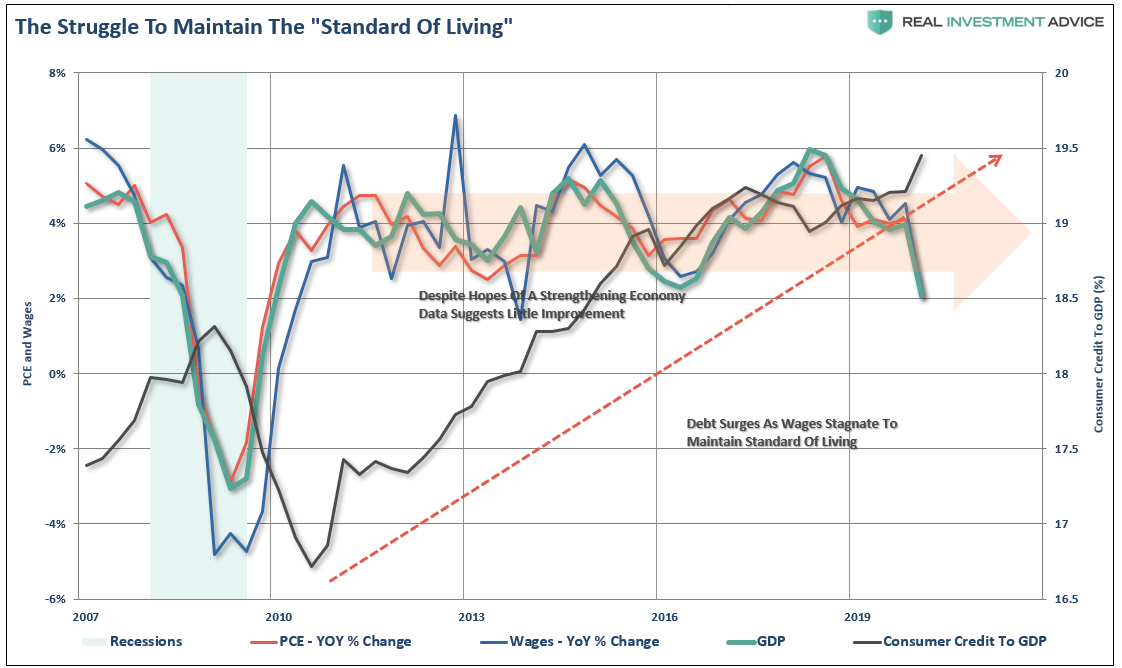
SINCE
THE “FINANCIAL CRISIS,” massive
levels of monetary accommodation, near zero-interest
rates, and loose lending policies did not increase rates of economic
prosperity. As shown below, what kept the economy growing at 2% were massive
increases in debt to sustain the “standard of living,” NOT
IMPROVE
See Chart:
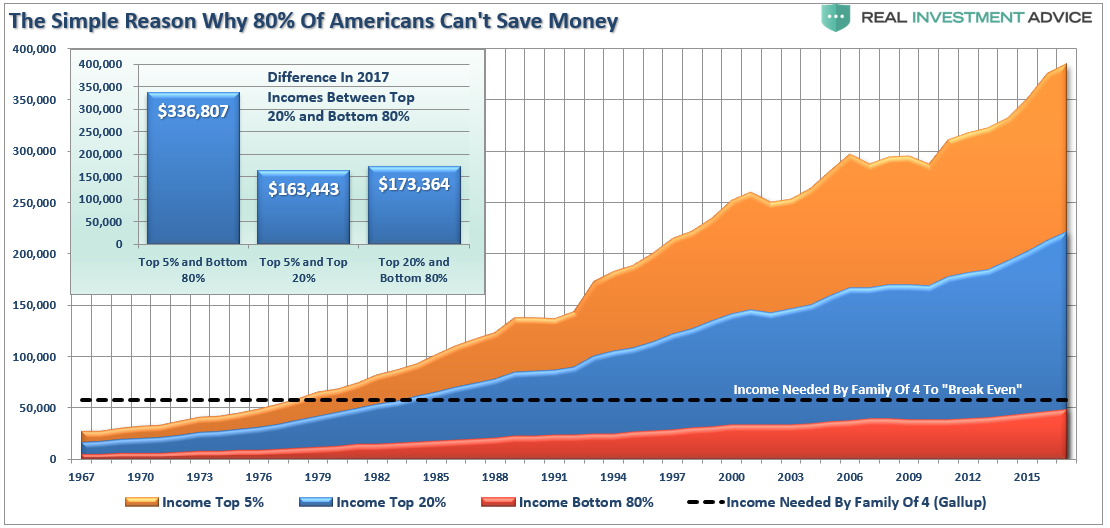
COST OF HAPPINESS
The differential between
incomes and the actual “cost of living” is quite
substantial. Researchers
at Purdue University found in their study of data culled from
across the globe, in the U.S., $132,000 is the optimal income
for “feeling” happy when raising a family of four. (I
can attest to this personally as a father of a family of six)
A Gallup survey found it required
$58,000 to support a family of four in the U.S. (Forget about being happy, we are talking about “just getting by.”)
See Chart:
LIVING ON DEBT
The Fed’s problem is shown in
the chart below. Beginning in 1990, the “gap” between
the “standard of living” and real disposable incomes inverted.
It was at this moment that wages alone were no longer able to meet the required
standard of living. To make up the difference,
consumers turned to debt.
See Chart:
https://www.zerohedge.com/s3/files/inline-images/Consumer-Spending-GAP-Debt-043020.png?itok=onGHPujs
However, following the “financial
crisis,” even the combined levels of income and debt no longer fill
the gap. Currently, there is a –-$3401.99 annual deficit that
cannot be filled.
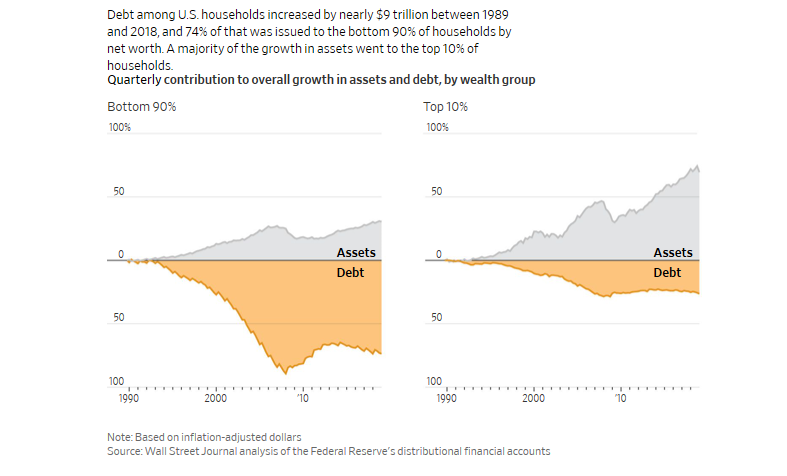
The
debt-to-income problem keeps individuals from building wealth, and government
statistics obscure the basic reality. We discussed this point in detail
in “Dimon’s
View Of Economic Reality Is Still Delusional:”
“The median net worth of households in the middle 20% of income rose 4%
in inflation-adjusted terms to $81,900 between 1989 and 2016, the latest
available data. For households in the top 20%, median net worth more than
doubled to $811,860. And for the top 1%, the increase was 178% to $11,206,000.
See Chart:
THE FED’S TRAPPED AT ZERO
The
debt problem exposes the risk posed to the Fed and why they are now forever
trapped at the zero-bound.
With an economy now $20
Trillion more in debt than it was before the financial crisis, any small
increases in interest rates have almost immediate and catastrophic results on a
debt-dependent economy.
As the
Fed’s balance sheet heads toward $10 Trillion, the Fed has stated that interest
rates will remain low until “such time as the dual mandates of full
employment and price stability achieved.” Given economic stability was
not achieved in the last decade, it is highly unlikely a more than doubling of
the Fed’s balance sheet will improve future outcomes.
Unfortunately, given we now
have a decade of experience of watching the “wealth gap” grow
under the Federal Reserve’s policies, the next decade will only see the “gap” worsen.
While
many are hoping for a “V-shaped” recovery following the “restart” of
the economy, the reality is recovery may take much longer than expected.
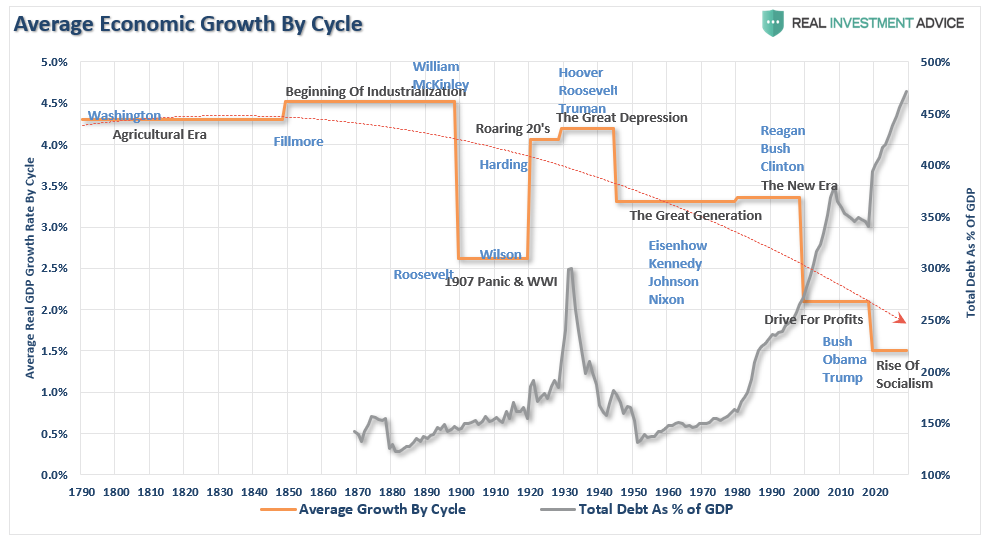
We now know that surging debt
and deficits inhibit organic growth. The massive debt levels added to the backs of taxpayers will only ensure
the Fed remains trapped at the zero-bound. The
chart below shows the 10-year annualized run rates of
economic growth throughout history with projected debt and growth levels over
the next decade.
See Chart:
END GAME
History is pretty clear about
future outcomes from the Fed’s current actions. More importantly, these actions
are coming at a time where there were already tremendous headwinds plaguing
future economic growth.
- An aging demographic
- A heavily indebted economy
- A decline in exports
- Slowing domestic economic growth rates.
- An underemployed younger demographic.
- An inelastic supply-demand curve
- Weak industrial production
- Dependence on productivity increases
The
lynchpin, like Japan, remains demographics and interest rates. As the
aging population grows becoming a net drag on “savings,” the dependency on the “social welfare net” will
continue to expand.
The problem is that after a
decade of pulling forward future consumption to stimulate economic activity, a further expansion of the wealth gap, increased
indebtedness, and low rates of economic growth, will weigh on future economic
opportunity for the masses.
Supporting economic growth through increasing levels of debt only makes sense if “growth
at all cost” uniformly benefits all citizens. Unfortunately, there
is a big difference between growth and prosperity.
But for now, the Fed has no
other choice.
….
----
----
No hay comentarios:
Publicar un comentario