ND MAR 31 19 SIT EC y POL
ND denounce
Global-neoliberal debacle y propone State-Social + Capit-compet in Eco
ZERO
HEDGE ECONOMICS
Neoliberal
globalization is over. Financiers know it, they documented with graphics
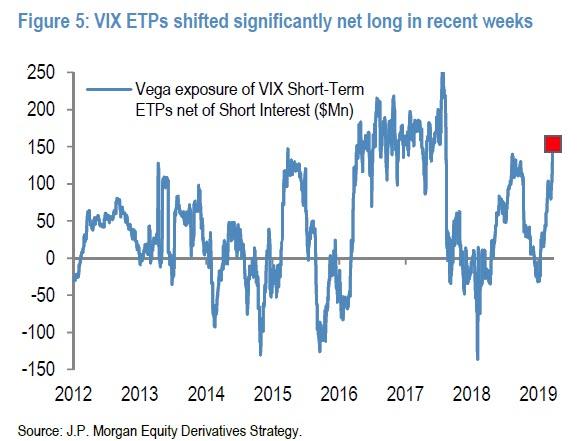
The long VIX trade in various ETPs is getting
dangerously crowded...
According to
JPMorgan's Bram Kaplan, after a years of relatively quiet, the net exposure
among VIX ETPs has recently spiked to their largest net long position in 1.5
years, tilted long by ~$150Mn vega, which is just shy of the record vega
exposure hit in early 2018 and which precipitated the VIX ETP implosion. However,
unlike 2018, this time
the trade is in the other direction as
investors piled into long and levered VIX ETPs beginning in February, as soon
as the VIX index fell below 16, to as JPM suggests. "position
for/speculate on the next volatility spike."
See Chart:
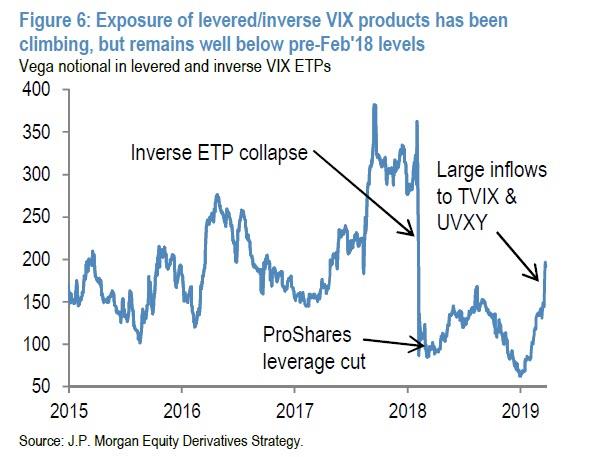
Specifically,
over this period, investors have deposited $600MM net into unlevered long VIX
ETPs, and $1.1Bn into levered products (the majority of which went into 2x
levered TVIX). Following these flows, the vega notional
in levered and inverse VIX ETPs has increased significantly, but remains well
below pre-Feb’18 levels.
See Chart:
Inverse ETP collapse
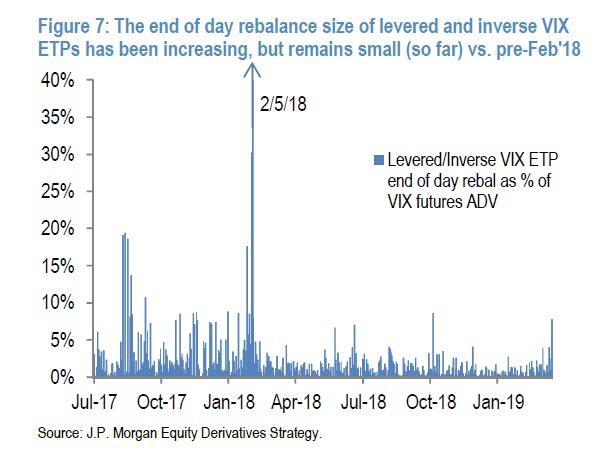
And here is
the cautious conclusion from JPM, which notes that while the bank doesn't - yet
- expect these ETPs to drive end-of-day short gamma rebalancing effects
anywhere close to those experienced on 2/5/18, "their end of day rebalances
are becoming material." To wit, the next chart illustrates how the end of
day rebalance requirements for levered and inverse VIX ETPs has been increasing
as a percentage VIX futures volumes, but remains small (so far, at least)
compared to pre-Feb’18.
The key thing is that as noted above, unlike last year's vol
selling stampede, the current build-up of long vega exposure in VIX ETPs
suggests they could provide a headwind to the next volatility spike...
See Chart:
... as investors are likely to take profits on these positions
and/or invest in inverse products to monetize the spike. On the other hand,
should the EOD rebalance persist, growing increasingly skewed in one direction
as contrarian traders boost their bets on a VIX spike in the coming months
using various ETP products, then it is only a matter of time before another
major VIX spike takes place, only this time instead of wiping out the vol
buyers, it results in a very generous pay day.
….
SOURCE:
----
----
"As one client
quipped this week, it really depends from which direction the jaws close –
through higher rates or via lower equity prices."
There have
been two conflicting themes in the market so far in 2019: the first one has
been the relentless selling by equity investors since the start of the new year
despite the market's remarkable surge in 2019, offset by buying of fixed income
securities in a scramble to lock up yield ahead of potential rate cuts and/or
QE by the Fed later in 2019 or in 2020 (most recently
discussed here).
See Chart:
Dovish Central Banks are pushing more money into fixed income
v. equitites
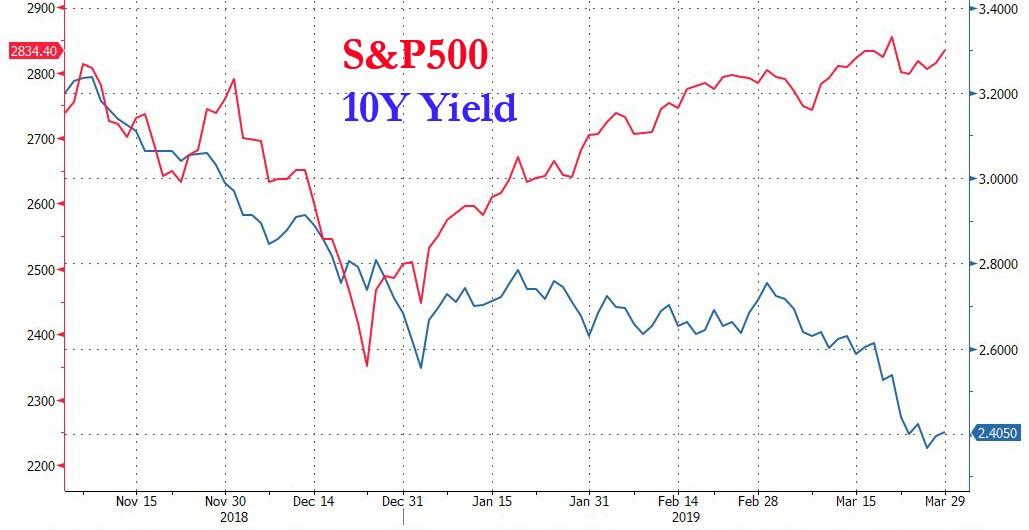
The second
theme, which is closely tied to the first, has
been the market's so-called "jaws", where stocks have
moved sharply higher while yields have tumbled to multi-year lows, sparking
investor confusion: is the bond market right in
anticipating a period of acute deflation and/or recession, or is it wrong and
stocks, which are less than 5% below their all-time highs, correct in their
optimistic outlook.
See Chart:
S&P500 10 Year Yield
As Goldman's
David Kostin writes, it is this decoupling that is dominating client
discussions:
Ten-year US Treasury yields have plunged to 2.4%. From an investor
perspective, stable equity prices coupled with falling interest rates means a
wider earnings yield gap and implies a more attractive relative value for
stocks assuming the economy does not fall into recession.
As Kostin
recounts, one client told the chief Goldman equity strategist, that it all really "depends
from which direction the jaws close – through higher rates or via lower equity
prices."
That's the
question that the bank tries to answer in its latest US Weekly Kickstart
report.
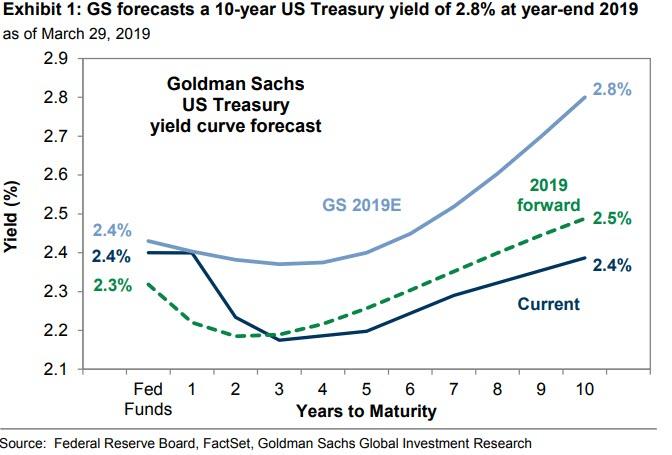
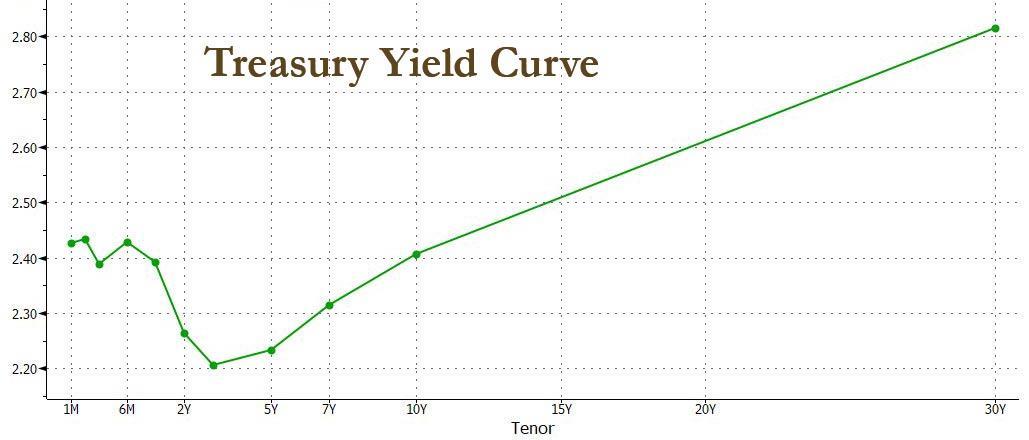
For its part, Goldman remains as usual cautiously
optimistic: The bank which last December incorrectly predicted no
less than 4 rate hikes in 2019, now forecasts the
10-year US Treasury yield will rise to 2.8% at year-end 2019 (down from the
previous forecast of 3.0%).
See Chart:
Golman Sachs US Treasury yield curve forecast 2.8% at year
end 2019
Next up is the
deteriorating corporate earnings picture, with Q1 looking especially grim with
the risk of a mini earnings recession on the horizon. To be sure, starting with
Apple in early January, management teams have been tempering earnings
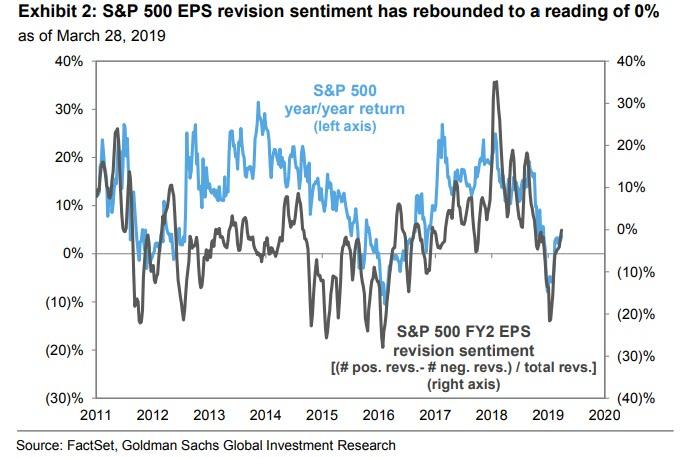
expectations. In fact, more than 140 firms have reduced 2019 EPS guidance since the start of the
year and 67 firms have cut guidance by more than 2%. As Goldman
notes, earnings revisions have been more negative than usual. During the
past three months, analysts have cut expectations for full-year 2019 S&P
500 EPS by 4%, nearly four times the usual rate of roughly 1% per quarter. On
the other hand, 1-month revision sentiment has rebounded to a reading of 0%.
See Chart:
S&P500 EPS revision sentiment has rebounded to 0% as of
March 28, 2019
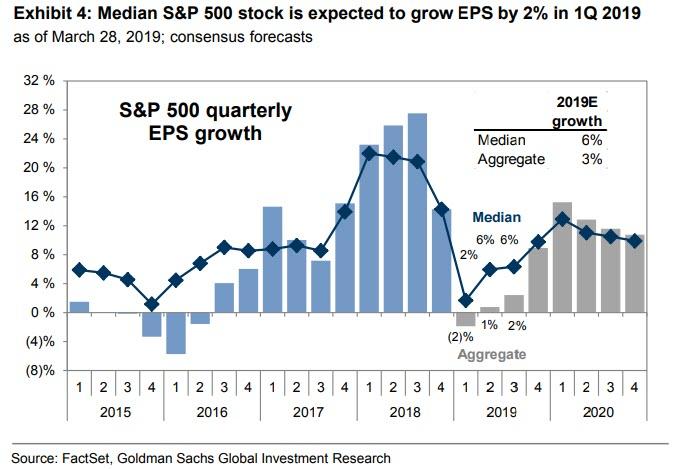
And while sell
ide earnings sentiment may have finally troughed,
consensus now expects aggregate S&P 500 EPS to fall by 2% in 1Q, which would be the first year/year decline
since 2Q 2016 even as consensus still expects strong 5% sales growth. One thing to note: while the
average print will be negative, the median S&P 500 stock is expected to
grow EPS by 2%, indicating that a few outsized firms (AAPL, MU, WDC, CVX, XOM,
NVDA) are weighing on the aggregate measure according to Goldman. This dichotomy is also present for full-year 2019 EPS growth,
with the median firm projected to grow EPS by 6% while the aggregate index
grows by just 3%.
See Chart:
Median
S&P500 stock is expected to grow EPS
by 2% in 1Q 2019
Conslusion: JPM strategist concludes that "there appears
to be a disconnect between rate and risky markets at the moment with rate MARKETS SIGNALING MORE ELEVATED GROWTH AND
RECESSIONS RISKS, and equity, credit and commodity
markets pricing in more optimistic scenarios."
….
----
----
"But if
investors believe America is succumbing to the secular stagnation that has
gripped Japan and Europe, and if they’re growing scared that global central
banks are no longer capable of rescuing markets, then we have a real
problem."
Three Worlds
“America’s yield curve inversion can mean one
of three things,” said the CIO. “We’re either
living in a world of secular stagnation and investors worry that central banks
no longer have sufficient policy tools to spur growth and inflation,” he
continued. “Or the economy is simply sliding toward
recession and the inversion will persist until the Fed panics and spurs a
recovery,” he said. “Or we’re living in a world,
where the market is moving in ways that defy historical norms because of global
QE. And if that’s the case, the curve is sending a false signal.”
See Chart:
Treasury Yield Curve
“If we’re sliding toward recession, then it seems odd
that credit markets are holding up so well,” continued the same CIO. “So keep
an eye on those,” he said. “And
if the curve is sending a false signal due to German and Japanese government bonds yielding less than zero out
to 10yrs, then the recent Fed pivot and these low bond
rates in America may very well spur a blow-off rally in stocks like in 1999.”
A dovish Fed in 1998 (post-LTCM) and 1999 (pre-Y2K) provided the liquidity
without which that parabolic rally could have never happened.
See Chart:
S&P%500 10 Year
Yield
“But if investors believe America
is succumbing to the secular stagnation that has gripped Japan and Europe, and
if they’re growing scared that global central banks are no longer capable of
rescuing markets, then we have a real problem,” said
the CIO. “Because a recession is bad for markets, but not catastrophic provided
that central banks can step in to spur recovery. But with global rates already so low, if investors lose faith in the
ability of central banks to do what they have always done, THEN WE’RE VULNERABLE TO A STOCK MARKET CRASH.”
….
----
----
Liquidity and central banks rule, nothing else matters... Yet, bulls have not proven their case.
The first
quarter of 2019 was a smash hit for bulls. Capitulating central banks, record buybacks flushing
the system with artificial liquidity, constant jawboning by dovish central
bankers and permanent promises of progress on a China trade deal, and a
collapsing yield picture bringing back TINA (there is no
alternative) all of which produced a relentless 3 month move higher back in
equities that rendered any fundamental issues of slowing growth, earnings and
even a yield curve inversion irrelevant and erased the losses of a disastrous
Q4 of 2018.
Liquidity and central banks rule,
nothing else matters. Optimism
is back and hope is pervasive that 2019 will replay the earnings recession case
of 2016 meaning that all bad news is priced in, any slowdown will be temporary
and markets will resume their 10 year bull trend with new highs to come.
Yet, bulls have not proven their
case. So far lower
highs on all key indices risking major potential topping patterns and hence the
upcoming earnings season may serve as a key pivot for markets in the weeks
ahead. Dovish central banks have been fully priced in
by markets and the liquidity of buybacks will at least temporarily disappear
during the buyback blackout window.
Bears have managed to keep price
below the January 2018 highs as well as the long term 2009 trend line, but are
also running out of time as a confirmed break above the January
2018 highs could set markets on a path to at least retest the highs or make new
highs.
Hence the time period in April into May sets
up for decision time for markets.
Risk to markets: The rally off of the December lows remains
untested and uncorrected with plenty of open gaps below while indices have
formed specific patterns that could be interpreted as bearish. Indeed the rally
has been so steep that it will require ever higher prices to avoid a confirmed
break of these patterns. Due to the vertical nature of this rally these
patterns are at risk of breaking to the downside if markets were to experience
just a few days of downside. As these patterns are very large sizable downside
and an increase in volatility could emerge on a confirmed break of these
patterns.
Timing matters as structurally
bulls have not been able to confirm a resumption of the larger bull trend hence
April may be a key month and bulls can hardly afford a down month.
I’m discussing
technicals and select key charts in the video below:
See VIDEO:
….
----
----
This time is unlikely to be different.
A Run For The Highs
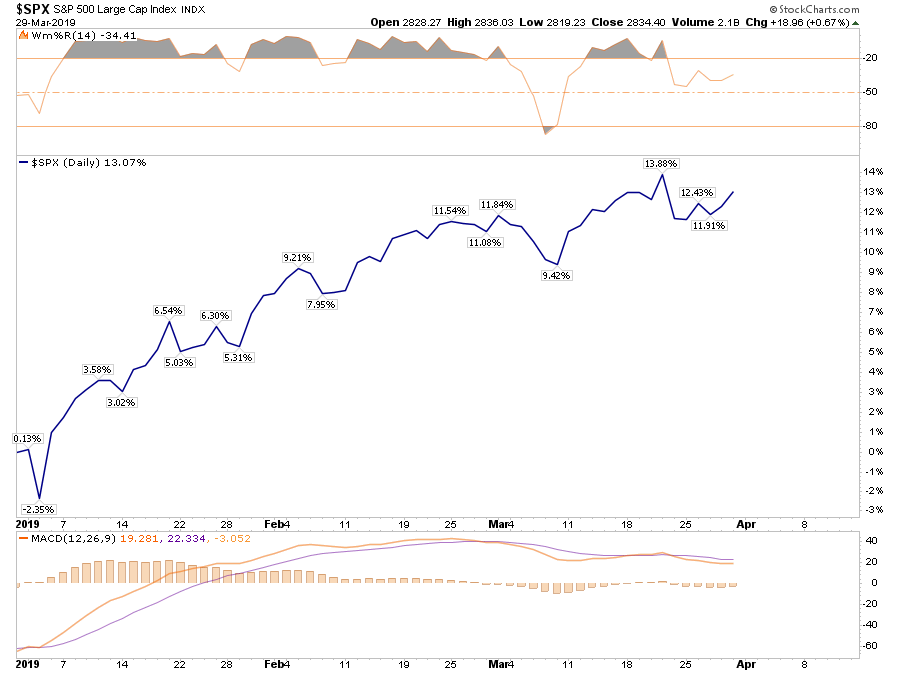
Friday wrapped up the first quarter of 2019, and it was the best quarterly performance since 2009. As shown in
the chart below, if you bought the
bottom, you are “killing it.”
See Chart:
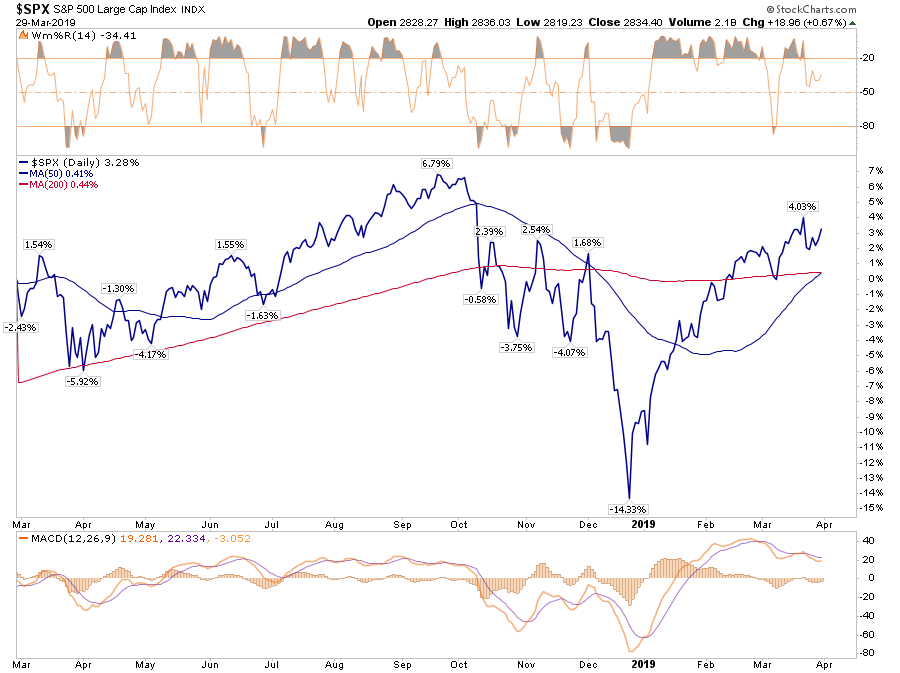
However, you didn’t.
Despite all of
the media “hoopla” about the rally, the
reality is that for most, they are simply getting back to even over the last
year.
See Chart:
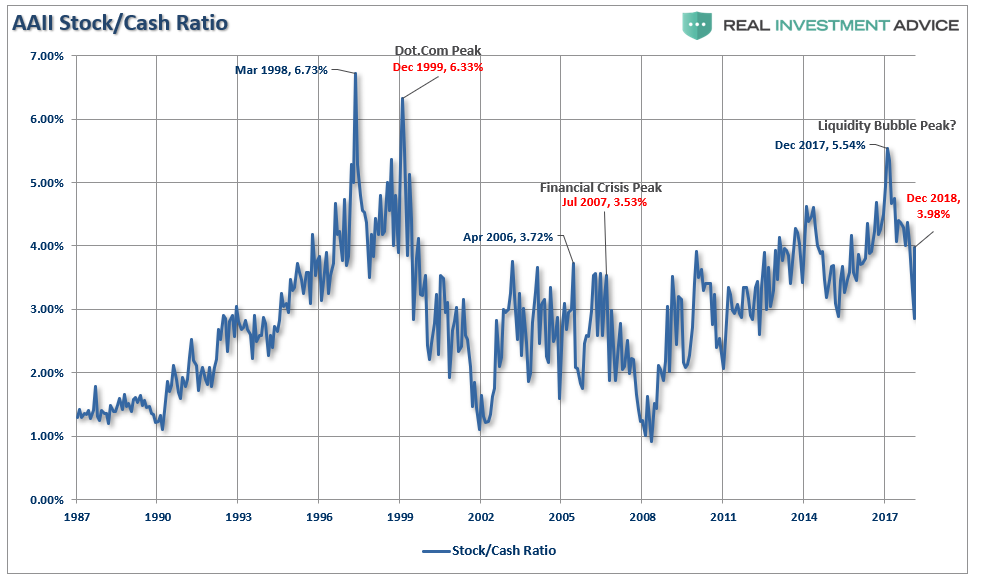
That is, assuming you didn’t “sell
the bottom” in December, which by looking at allocation changes,
certainly appears to be the case for many.
See Chart:
If we deconstruct the ratio we can see the rotation a bit
better
See Chart:
Not
surprisingly, historically speaking, investors had their peak stock exposure
before the market cycle peak. As the market had its first stumble, investors sold. When the
market bounces, investors are initially reluctant to chase it. However, as the
rally continues, the “fear of missing out or F.O.M.O” eventually forces
them back into the market. This is how bear market rallies work;
they inflict the most pain possible on investors both on the bounce and then on
the way back down.
However, for
the moment, we are still in the midst of a bear market rally. This will be the
case until the market breaks out to new highs. Only then can we confirm the
previous consolidation is complete and the bull market has been
re-established.
The good news is on a very
short-term basis, the market IS INDEED bullishly biased and coming off an
extremely strong first quarter rally. The
current momentum of the market is strong as bullish optimism has regained a
foothold.
But, as we
noted for our RIA PRO Subscribers last week, (Free 30-Day Trial with Code: PRO30) complacency
has moved back to extremes which suggests that a further rally isn’t “risk
free.”
“The graph below is constructed by normalizing VIX (equity volatility),
MOVE (bond volatility) and CVIX (US dollar volatility) and then aggregating the
results into an equal-weighted index. The y-axis denotes the percentage of time
that the same or lower levels of aggregated volatility occurred since 2010. For
instance, the current level is 1.91%, meaning that only 1.91% of readings registered at a lower level.
See Chart:
Multi-Asset Volatility Index
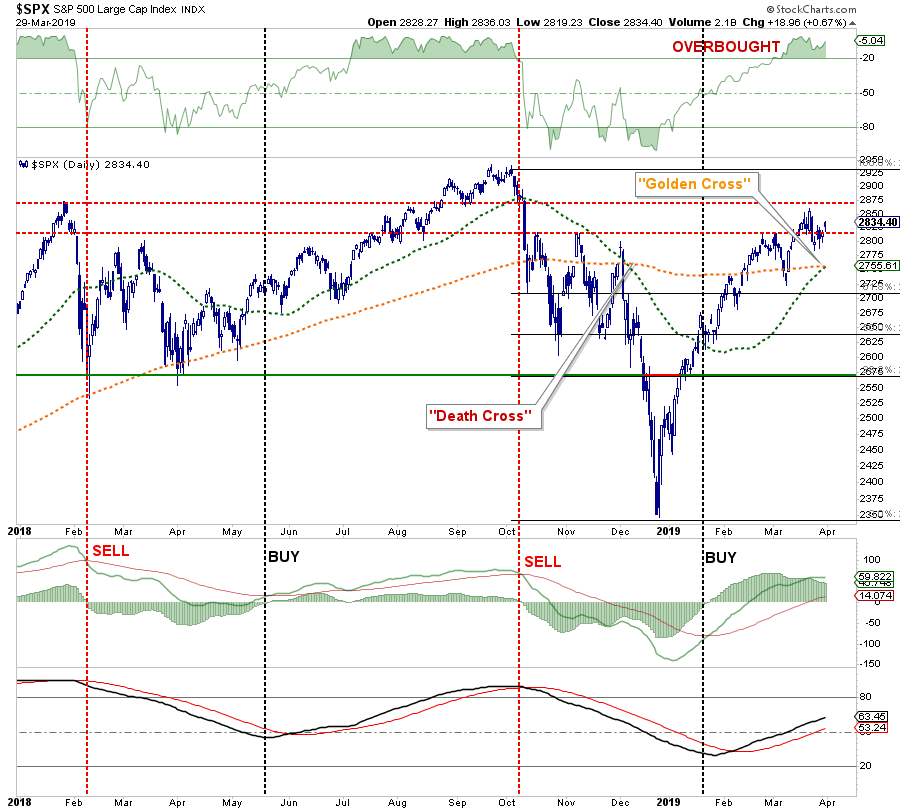
Nonetheless,
the markets are close to registering a “golden cross.” This is
some of that technical “voodoo” where the 50-day moving
average (dma) crosses above the longer-term 200-dma. This “cross” provides substantial support
for stocks at that level and limits downside risk to some degree in the
short-term.
See Chart:
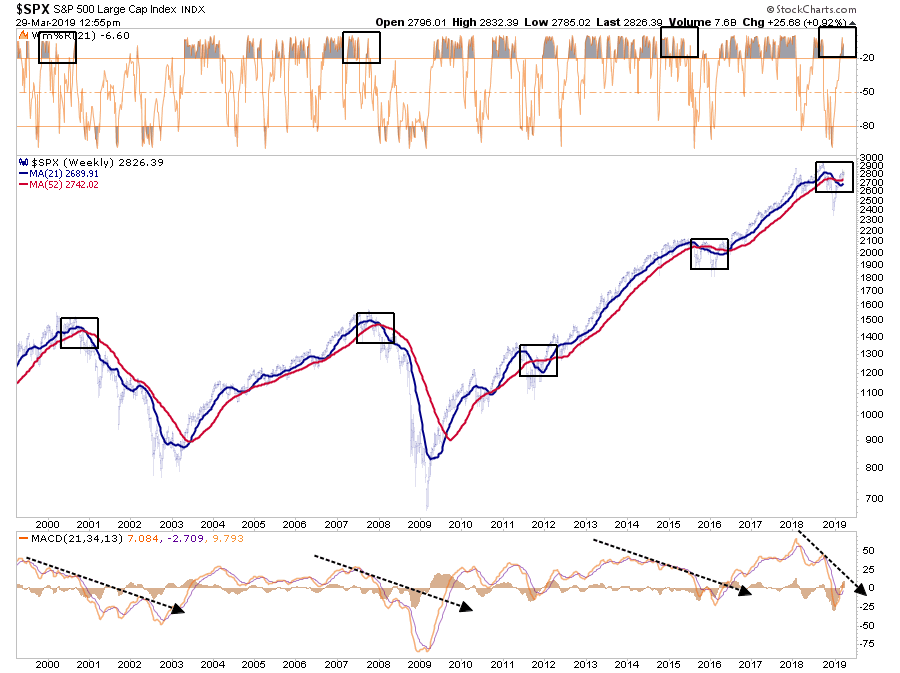
The next chart shows the longer-term version
of the chart above using WEEKLY data. The parameters are set for a
slightly longer time frame to reduce the number of “false” indications. I have accentuated the moving averages to have them more
clearly show the crosses.
See Chart:
From a portfolio management standpoint, what
should you do?
In the short-term the market
remains bullishly biased and suggests, with a couple of months to go in the
“seasonally strong” period of the year, that downside risk is somewhat limited.
“Ignore the yield curve they said. It’ll be
fun they said.”
Last
week, Mark
Kolanovic of J.P. Morgan stated:
“Historically, equity markets tended to produce some of the strongest
returns in the months and quarters following an inversion. Only after [around]
30 months does the S&P 500 return drop below average,”
See Chart:
S&P500 after
inversion:
https://www.zerohedge.com/s3/files/inline-images/MW-HG413_JPMinv_20190326135102_NS.png?itok=wfrddGhL
Conclusion
Pay attention
to these longer-term trend changes as historically they signify bigger issues
with the market.
It is unlikely
this time is different. There are too many indicators already suggesting higher
rates are impacting interest rate sensitive, and economically important, areas
of the economy. The only issue is
when investors recognize the obvious and sell in the anticipation of a market
decline.
The yield
curve is clearly sending a message which shouldn’t be ignored and it is a good
bet that “risk-based”investors will likely act sooner rather than
later. Of course, it is simply the contraction in liquidity that causes the
decline which will eventually exacerbates the economic contraction. Importantly, since recessions are
only identified in hindsight when current data is negatively revised in the
future, it won’t become “obvious” the yield curve was sending
the correct message until far too late to be useful.
While it is unwise to use the “yield curve” as
a “market timing” tool, it is just as unwise to completely
dismiss the message it is currently sending.
….
----
----
US DOMESTIC POLITICS
Seudo democ duopolico in US is obsolete; it’s full of frauds
& corruption. Urge cambio
... for “roughly three
minutes a night, every night, for an astonishing 791 days,” the
media has been poking this mystical Russian bear which has turned into – in the
president’s words – a Collusion
Delusion.
====
Why is it that no one defends free markets, and socialism, despite all the evidence of its failures, comes back
again and again? Unsurprisingly, the answer lies in politics...
Why is
it that no one defends free markets, and socialism, despite all the evidence of
its failures, comes back again and again? Unsurprisingly, the answer lies in
politics, which have always led to a boom-bust cycle of collective
behaviour. Furthering our understanding of this phenomenon is timely because
the old advanced economies, burdened by a combination of existing and future
debt, appear to be on the verge of an unhappily coordinated bust. But that does not automatically return us to the free markets
some of us long for.
Check these
subtitles:
CYCLES OF COLLECTIVE BEHAVIOR
To understand
why free markets are more often than not unpopular, we must put them into a
context of human behaviour. In this regard we can stylise a cycle of collective behaviour into three
characteristic phases.
- The first is a lawless condition of no secure ownership of property rights; in the absence of enforceable law the means of possession are necessarily violent and uncertain. It is the natural condition of tribalism and pre-civilisation societies. It is the condition to which humanity returns when the cycle completes.
- The second phase is the consolidation of property ownership, with enforceable laws to define and protect it. Out of the chaos that fails to advance the condition of the people comes order, and with it the aggregation of the means of production. Capital in all the forms necessary for production accumulates, and being scarce, is used most efficiently. The backbone of this phase is freedom for the individual to dispose of his or her resources at will. The pace of improvement in the human condition is governed by the level of accumulated wealth and technological innovation.
- The third phase is the abandonment of free markets in favour of state control. The state, whose primary function in economic terms is to act as provider and facilitator of the law, increasingly supresses commerce by extracting escalating levels of tax. Taxes are imposed to redistribute wealth from those that earned and conserved it to those that did not. The state takes control of money, issuing its own currency which it can print at will. The damages to the economy are covered up by all the artifices available to the state.
The state regulates. The state confiscates. The state deprives its people of their freedom. The
state’s demands become so insatiable, so counterproductive, so impoverishing
that the economy collapses back into the first phase of the next cycle.
EMPIRICAL EVIDENCE OF THE CYCLE.
The assembly of German states into a unified
nation in 1871 gave credence to a new socialising phenomenon, whereby Bismarck,
Germany’s first Chancellor, promoted the state as a socialising entity,
superseding free markets. He was the first politician to create a
welfare state, introducing accident and old-age insurance and socialised
medicine. Shortly after unification, in the mid-1870s Bismarck abandoned free
trade and introduced trade protectionism.
More
subtitles:
THE PSYCHOLOGY OF DENYING FREE
MARKETS
CONTEMPORARY SOCIALIST EVOLUTIONS
Conclusion?
Witness the
struggle with Brexit, where it turns out the Westminster Parliament is
comprised of an overwhelming majority of members who are committed to the EU’s
socialising masterplan to the exclusion of democracy. Even a majority of Tory
MPs, the party of free enterprise, prefers a federal socialist system to free
markets.
It is
the stuff of late-stage socialism. The
whole world is in its grip, rather than just Germany, just the USSR, just
America, just the EU, or just Britain. And these are only some among the
traditionally advanced nations. Being cyclical, the bankruptcy of it all in
time is for sure. It is set to throw up greater challenges than ever seen
before because of its ubiquity. Assuming it does not end in a nuclear
destruction of the human race, we will eventually turn our backs on the follies
of socialising governments and go back to free markets. Then the cycle of humanity’s socialising madness will start all
over again.
…
[[ Certainly this
author needs to know What is what is not socialism. I’be back on this ]]
The same with the coming article:
RELATED:
When the economy collapses, everybody will blame capitalism, because Trump is somehow, incorrectly, associated with
capitalism... the young and poor will look to the government to 'do
something'... andsocialism as a kind
and gentle answer.
----
----
"The political correctness people are the most alienated and emotionally weak element
in the society. Yet they dominate in the media, entertainment, universities, and art
world..."
====
"...If you don’t treat me right, my people will get you..."
====
US-WORLD ISSUES (Geo
Econ, Geo Pol & global Wars)
Global
depression is on…China, RU, Iran search for State socialis+K-, D rest in limbo
And Europe is starting to take notice, and follow
suit...
====
Several Russian banks have joined the China International Payments
System (CIPS) also known as
China's "SWIFT", to ease operations between the two countries
====
"Russia is not
changing the balance of power in the region, Russia is not threatening anyone."
====
SPUTNIK and RT SHOWS
GEO-POL n
GEO-ECO ..Focus on neoliberal expansion
via wars & danger of WW3
====
SHOWS RT
----
----
NOTICIAS IN SPANISH
Lat Am search
f alternatives to neo-fascist regimes & terrorist imperial chaos
VIENTO SUR
FEM Cambiarlo todo. Bases y
desafíos de la Huelga Fem Julia
Cámara
====
RT EN ESPAÑOL
- Maduro: "El sist eléctr nacional de Ven fue penet por virus desde USA"
- Bolsonaro apertura oficina de negoc en Jerusalén, no de la Embajada
- Papa: "Estamos en una tercera guerra mundial a pedacitos"
- Netanyahu: Israel está listo para una "campaña extensa" en Gaza
- Gob VEN suminist agua a nivel nacion mientras contrarrest cortes eléctric
- Zelenski y Poroshenko seenfrentarian en 2da vuelta de presid ucranianas
- Perros portarian nuevo virus potencialmente mortal para los humanos
- Líder comunero pide diálogo con el Gob peruano sobre mina Las Bambas
- comunidad internacional critica la decisión de Trump sobre Altos del Golán
- Especial Black lives: Agentes del cambio (Episodio 5)
----
----
GLOBAL RESEARCH
Geopolitics
& Econ-Pol crisis that leads to more business-wars from US-NATO allies
----
----
PRESS TV
Resume of
Global News described by Iranian observers..
----
===