JUN
20 ND SIT EC y POL
ND denounce Global-neoliberal debacle y propone State-Social
+ Capit-compet in Eco
ZERO HEDGE ECONOMICS
Neoliberal globalization is over. Financiers know it, they
documented with graphics
$10.4
trillion in fiscal stimulus and $7.9tn in monetary stimulus - for a grand total
of 20.8% of global GDP, injected mostly in just the past 3 months!
On Friday, we relayed the latest
observations from BofA chief investment officer, Michael Hartnett who concluded that there is just one bull market to short - namely credit -
"and the Fed won't let you" by which he means all central
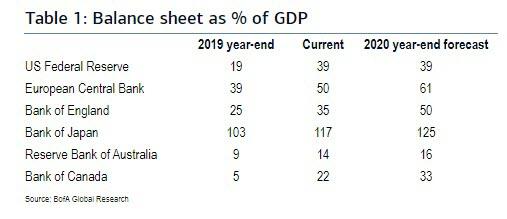
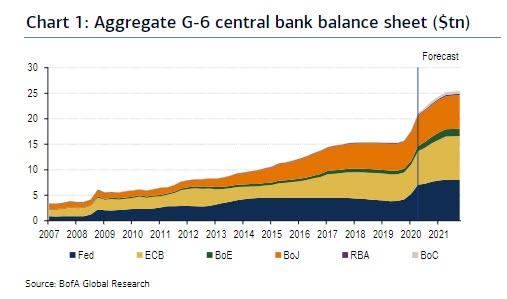
banks. As the following table shows, the balance
sheet of the G-6 central banks has exploded, with the Fed's total asset
expected to double in 2020 amid an avalanche of money printing.
SEE TABLE:
And
visually:
SEE CHART:
Of course, it's not just central
banks: as Hartnett also explained there is also the
2020 fiscal bazooka which has a way to go, with the massive fiscal stimulus
unleashed post-covid taking 3 forms in 2020: spending, credit guarantees, loans
& equity.
Hartnett also noted that according
to BIS data, US & Australia lead spending (>10%
GDP), Europe is using aggressive credit guarantees (e.g. Italy 32% GDP), while
Japan/Korea are stimulating via government loans/equity injections.
But the most staggering fact was
when one puts it all together.
According to BofA calculations, in
addition to the record 134 rate cuts YTD, the amount of total global stimulus, both fiscal
and monetary, is now a "staggering" $18.4 trillion in 2020 consisting
of $10.4 trillion in fiscal stimulus and $7.9tn in monetary stimulus - for a
grand total of 20.8% of global GDP, injected mostly in just the past 3 months!
And to think none of this would
have been possible if officials had not collectively decided
to shutdown the global economy in response to the ‘coronavirus pandemic’.
….
----
----
U.S.’ energy dominance agenda is dead as the country’s shale
industry is looking at a steep production decline...
·
U.S.’ energy dominance agenda is dead as the
country’s shale industry is looking at a steep production decline.
·
The U.S. tight oil or shale rig count has fallen
69% this year from 539 in mid-March to 165 last week.
·
U.S. oil import dependence is set to grow in
the next couple of years.
U.S. energy dominance is over. Output is probably going to drop by 50%
over the next year and nothing can be done about it. It has nothing to do
with the lack of shale profitability or other silly memes cited by people who
don’t understand energy.
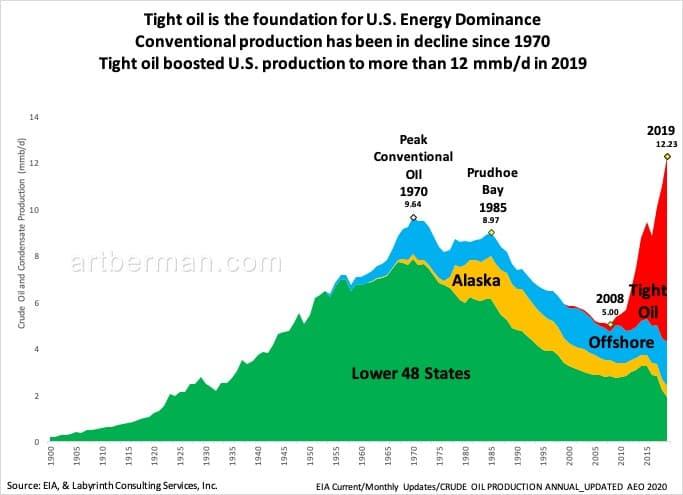
Conventional production has been declining since 1970. It fell from
almost 10 mmb/d in 1970 to 5 mmb/d in 2008.
Figure 1. Tight oil is the foundation for U.S.
Energy Dominance.
SEE CHART:
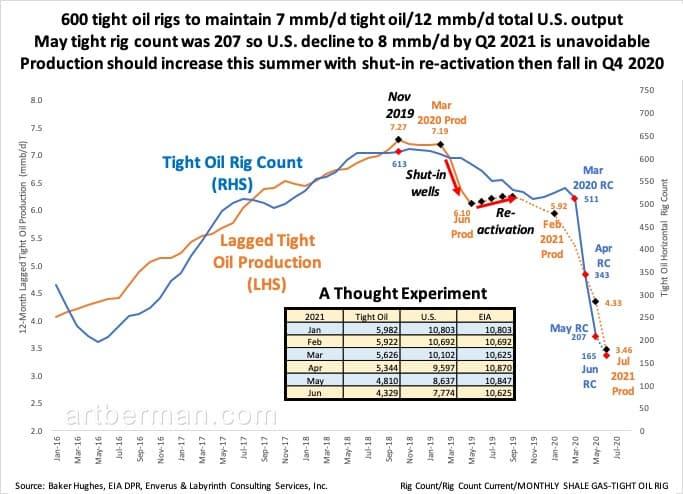
The horizontal rig count is now 165
so it is unavoidable that production will fall. The considerable lags and leads
mean that production decline cannot be expected to reverse until well into 2021
assuming that it starts to increase immediately. That
won’t happen because of constrained budgets and low oil prices.
Figure 2. 600 tight oil rigs to maintain 7
mmb/d tight oil/12 mmb/d total U.S. output.
Killer Decline Rates Require Lots of Rigs
Lower U.S. crude and condensate production is unavoidable with rig counts
where they are today. That is because tight oil decline rates are really high.
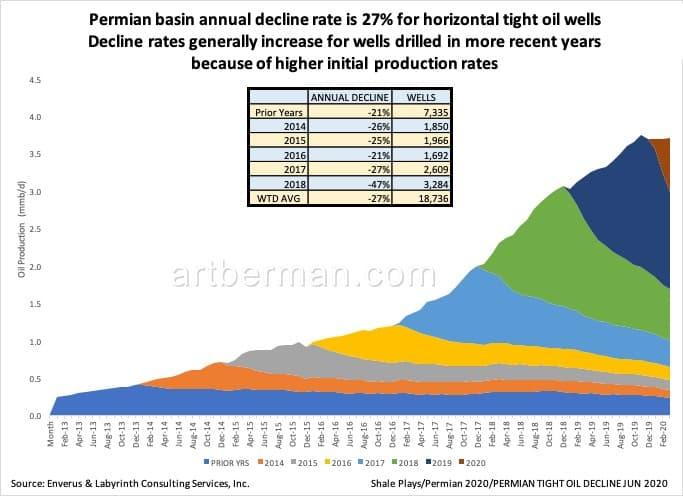
Figure 3 shows Permian basin shale play decline rates by year of first
production. The average of all years is 27% per year. More recently drilled wells decline at
higher rates because of better drilling and completion technology. The problem
is that the wells don’t have greater reserves—they just produce the reserves
faster. That means higher decline rates.
Figure 3. Permian basin annual decline rate is
27% for horizontal tight oil wells
SEE CHART:
The current June rig count of 165 will continue to fall for several
months because of low oil price & capital budgets.
Figure 4. It took 2.5 years for tight oil rig
count to increase from 193 in May 2016 to 618 in November 2018.
SEE CHART:
June rig count of 165 will fall for several
months based on oil price & capital budgets.
Source: Baker Hughes, IEA DPR, Enverus and
Labyrinth Consulting Services, Inc.
Rigs Don’t Produce Oil,
Wells Do
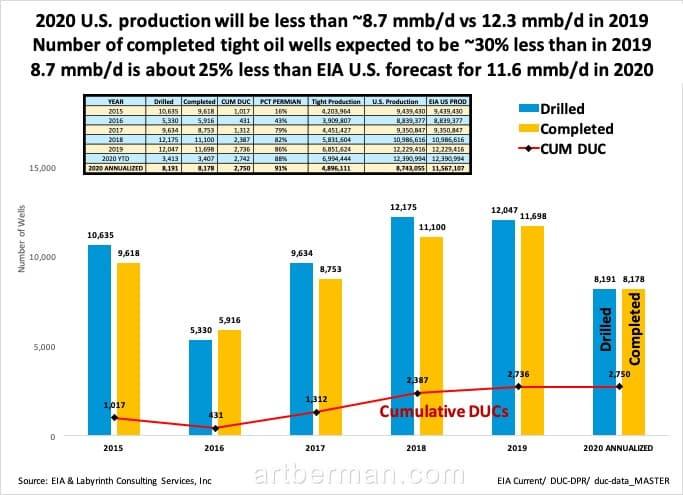
This approach suggests that 2020 tight oil production will be about 30%
less than in 2019 (Figure 4). Since tight oil represented 56% of total U.S.
output in 2019, we may then estimate that U.S. production will average about
8.7 mmb/d in 2020.
Figure 5. 2020 U.S. production will be less
than ~8.7 mmb/d vs 12.3 mmb/d in 2019.
SEE CHART:
Energy Dominance and Green Paint
Much lower U.S. oil production is bad for Trump’s Energy Dominance anthem
and its corollary that the U.S. is energy independent. It’s even worse for oil
prices and the U.S. balance of payments once demand recovers. We will have to
import even more oil than we do today and it will cost more.
But a new phase of economic reality and oil pricing is unfolding and no
one knows where it will lead. Lower demand may mean that reduced U.S. oil
output is appropriate. The only thing that seems certain is that the U.S. will
not be the oil super power it was before 2020.
….
----
----
"I’m sharing this trade ... so you
can hail me as the obliterating moron that infamously shorted the greatest
rallyfloating weightlessly ever higher above the worst economic and
corporate crisis imaginable..."
I hate shorting. The
risk-reward relationship is out of whack. It feels crappy. I lost a ton of
money shorting the worst highfliers a little too early in late 1999.
I’m sharing this trade so that everyone gets
to ridicule me and hail me as a moron and have fun at my expense in the
comments for weeks and months every time the market goes up. And I do
not recommend shorting this market; it’s nuts. But here’s why I did.
The stock market had just gone through what
was termed the “greatest 50-day rally in history.”
There are now 29.2
million people on state and federal unemployment insurance. There are
many more who’ve lost their work who are either ineligible for unemployment
insurance or whose state hasn’t processed the claim yet, and when they’re all
added up, they amount to over 20% of the labor force. This is horrible.
But stocks just kept surging even as millions
of people lost their jobs each week. The more gut-wrenching the
unemployment-insurance data, the more stocks soared.
Then there is the desperate plight many
companies find themselves in, and not just the airlines – Delta warned of a
host of existential issues including that revenues
collapsed by 90% in the second quarter – or cruise lines –
Carnival just reported a revenue collapse of 85% in Q2, generating a $4.4
billion loss, and it is selling some of its ships to shed the expense of
keeping them.
These companies are in sheer survival
mode. This crisis hit manufacturers
whose plants were shut down. It hit retailers and
sent a number of them into bankruptcy court. It crushed clinics and
hospitals that specialize in elective procedures. It shut down dental offices.
It sent two rental car companies into bankruptcy court.
The situation has gotten so silly in the stock
market that the shares of bankrupt Hertz [HTZ]
– which will likely become worthless
in the restructuring as creditors will end up getting the company –
were skyrocketing from something like $0.40 a share on May 26 to $6.28
intraday on June 8, which may well go down in history as the craziest moment of
the crazy rally.
Even during the crazy dotcom bubble in late
1999 and early 2000, the day-trader frenzy hadn’t reached these levels. But
back in 1999, the economy was strong. Now this is the worst economy of my lifetime.
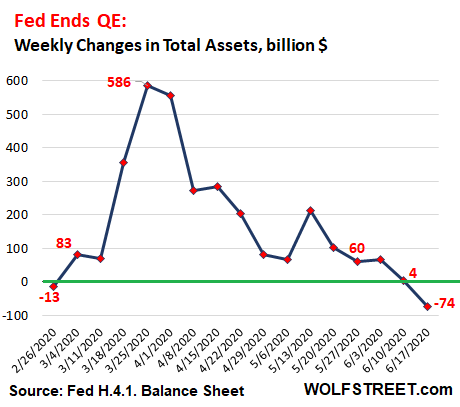
These are the times of record Federal Reserve
money printing. Between March 11 and June 17, the Fed printed $2.8
trillion and threw them at the markets – frontloading the whole thing by
printing $2.3 trillion in the first month.
But over the past six weeks something new was
developing: While the Fed was talking about all the asset purchase programs it
would establish via its new alphabet-soup of SPVs, it actually curtailed the
overall level of its purchases.
Then in the week ended June 10, the Fed’s
total assets of $7.1 trillion increased by less than $4 billion. And in the
week ended June 17, its total assets actually fell by $74 billion (you
can read my
analysis of the Fed’s balance sheet here). This chart of the
week-over-week change in total assets shows how the Fed frontloaded its QE in
March and April, and how it then systematically backed off.
SEE CHART:
FED ENDS QE:
And there is another big shift in how the Fed
is now approaching the crisis. It’s shifting its
lending and asset purchases away from propping up financial markets toward
propping up consumption by states and businesses, and ultimately
spending by workers/consumers via its municipal lending facility, its PPP loan
facility, and its main-street lending facility. These funds are finally flowing
into consumption and not asset prices.
So the superpower that created $2.8 trillion
and threw it at this market, and that everyone was riding along with, has
stopped propping up asset prices.
And now the market, immensely bloated and
overweight after its greatest 50-day rally ever, has to stand on its own feet, during the worst
economy in my lifetime, amid some of the worst corporate earnings approaching
the light of the day, while over 30 million people lost their jobs. It’s a terrible gut-wrenching scenario all around.
And so I stuck my neck out, and I’m sharing
this trade for your future entertainment when it goes awry, and you get to have fun at my expense and hail me as the
obliterating moron that infamously shorted the greatest stock market rally of
all times as it was floating weightlessly ever higher above the worst economic
and corporate crisis imaginable.
….
SOURCE:
https://www.zerohedge.com/markets/i-who-hates-shorting-just-shorted-entire-stock-market-heres-why
----
----
"The April/May strategy of owning
anything is unlikely to perform as well going forward."
In the latest weekly JPMorgan View report by
John Normand, the strategist answers the four most common questions that
have arisen after such strong market performance:
1. how much
longer will the growth boom last;
2.
how much of that recovery is already discounted in
asset prices;
3. which
wildcards, both negative and positive, are most material in coming months; and
4.
why not just own anything when growth is improving,
policy hyper-stimulative and cash holdings extraordinary.
Before we get to the answers, a quick rundown
of where the markets are today: [ Get this info by opening the SOURCE
AT HE END OF THIS ART ]
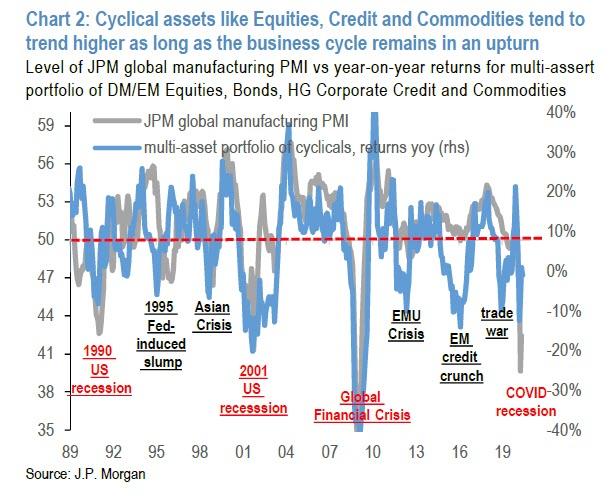
1. How much longer will
this "growth boom" last? According to Normand, what will matter for
most asset prices over Q3 and possibly Q4 is "the near-term momentum
rather than the medium-term malaise." This judgement reflects a simple
observation that most cyclical assets tend to rise in price/tighten in spread
as long as the global business cycle is in an upturn which for now it is due to
the tremendous drop in March and April.
SEE CHART:
2. Is the recovery priced
in, or "what is the completeness of the growth/profits recovery." That is why the bank has judged valuations
from a few perspectives: (1) a long-term
framework based on generally mean-reverting measures like forward P/Es for
Equities, spreads for Credit and real (inflation-adjusted) levels of exchange
rates, commodity pries and bond yields for the rest of the FICC universe; (2) a short-to-medium term framework that scores
markets on the degree of retracements they tend to experience in the last month
of recession and the first few quarters of an expansion.
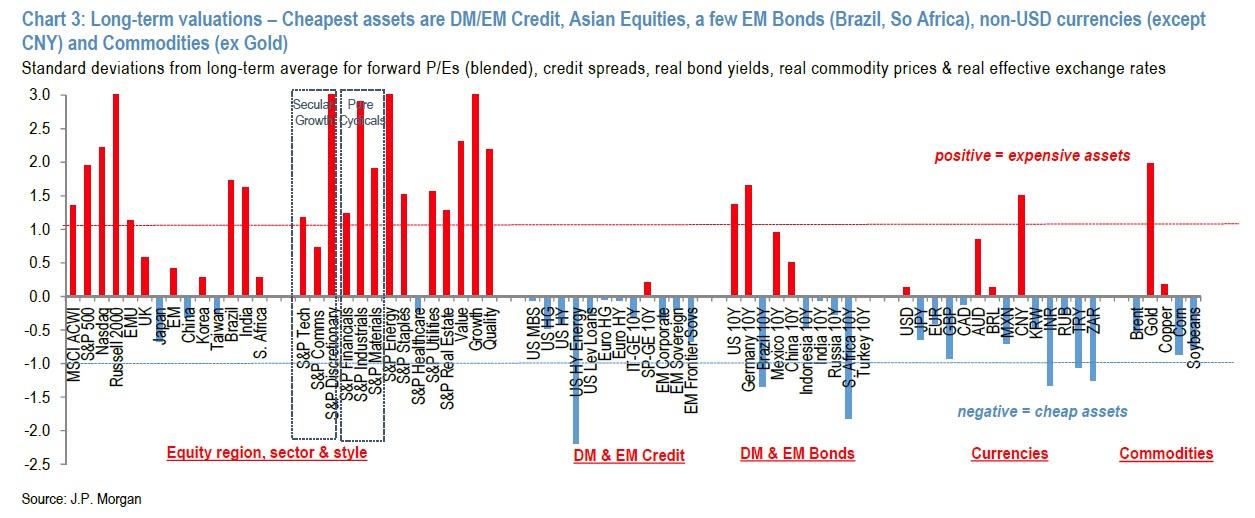
Long-term measures, where
valuations for each asset class, sector or security are expressed in standard
deviations from their multi-decade averages (chart 3), suggest that the
cheapest markets are DM/EM Credit followed by Asian Equities; a few EM Bonds
(Brazil, South Africa); non-USD currencies (ex CNY); and some Commodities (Oil,
Agriculture).
SEE CHART
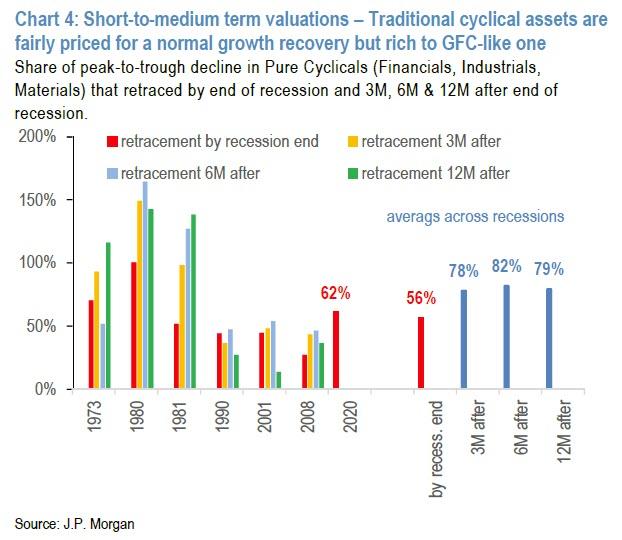
Short-to-medium term measures, which compare
recent market retracements to those that typically occur at business cycle
turning points, suggest fair value if the global economy recovers lost output
extremely quickly, but broad expensiveness if the malaise sets in.
So if the emerging recovery mirrors all
previous recessions from 1970 to 2001, then markets are fairly valued. But
if the recovery proves more anemic like the post-Global Financial Crisis years
were due to impaired balance sheets, then markets have overshot. JPM thinks the GFC is the proper template and are therefore
concerned about valuations, which is why its portfolio strategy is conservative.
SEE CHART:
The wildcards, both positive and negative. This potential
valuation problem makes more relevant the role of wildcards. Perhaps because
market momentum has been so strong in recent months, the sources of
downside risk in H2 seem more abundant than the sources of upside.
The most material ones to JPM are COVID
infections because these are indeed rising in a few US states...
SEE CHART:
the Democratic
sweep because swing state polls favor both Biden versus Trump and Democrats
versus Republicans in vulnerable Republican Sentate seats...
SEE CHART:
Voting intentions favor Dems but only by a thin margin
and broader US sanctions on China will affect US
public and both sides of the US political spectrum that hold an overwhelming negative impression of
China (66% of Americans have an unfavorable view of China, according to an
April Pew Research Center poll). The bank then admits that it isn't properly
hedged against a second wave that triggers lockdowns, other than through a
preference for the Tech and Healthcare sectors, because there is sufficient
hospital capacity to accommodate the inevitable rise in infections as mobility
increases.
This brings us to JPM's punchline: does any of
the above actually matter at a time when there has been an unprecedented
liquidity injection in the markets? The answer is that while the rising tide
has indeed lifted all boats, it can only do so much:
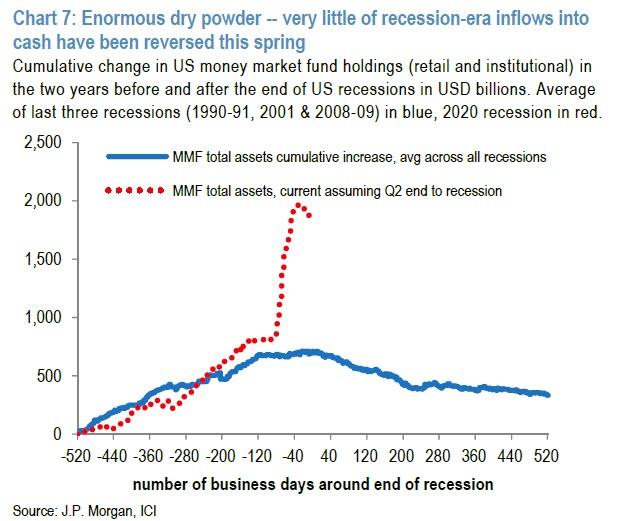
The case for selectivity: According to
Normand, "liquidity cannot paper over specific weaknesses
indefinitely." When the business cycle is turning
higher, policy hyper-stimulative and downside risks manageable, the obvious
investment strategy might be to own anything but cash, holdings of which remain
extraordinarily high.
SEE CHART:
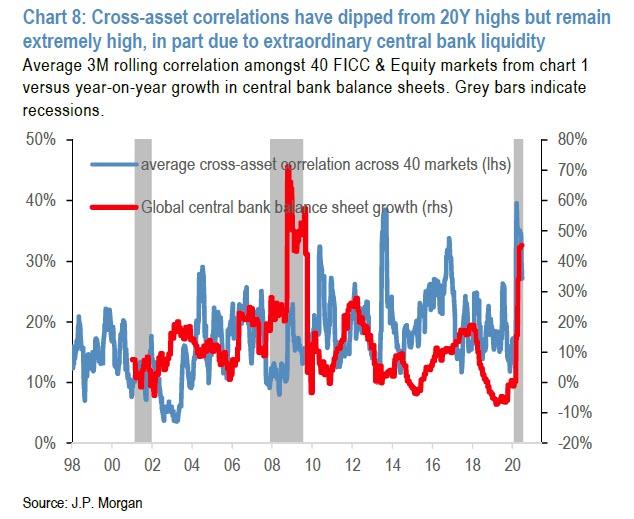
Massive central bank asset purchases can also
boost correlations due to a combination of scarcity created by central bank
asset purchases and rising growth expectations from central bank easing.
SEE CHART:
https://www.zerohedge.com/s3/files/inline-images/cross%20asset%20correaltion%20jpm.jpg?itok=r-Ssbe-1
However, typically such high correlations
mean-revert to their long-term averages within a few months, in part because
the pace of QE slows and in turn allows country, sector and company-specific
factors to reassert themselves. H2 should bring
this sort of differentiation, which is why the April/May strategy of owning
anything is unlikely to perform as well going forward.That would mean these
choices:
But typically these high correlations
mean-revert to their long-term averages within a few months, in part because
the pace of QE slows and in turn allows country, sector and company-specific
factors to reassert themselves. H2 should bring this
sort of differentiation, which is why as JPM concludes, "the April/May
strategy of owning anything is unlikely to perform as well going forward."
….
----
----
US
DOMESTIC POLITICS
Seudo democ duopolico in US is obsolete; it’s full of frauds
& corruption. Urge cambio
Younger voters worry most about another civil war...
====
Censorship :
If you’re looking ahead and the future looks bright, that might be because you’re
seeing the country on fire...
====
The Furer don’t accept sacking,, only total obedience &
quiet fear.. unless all resign
"I
will be leaving the U.S. Attorney’s Office for the Southern District of New
York, effective immediately."
….
Si los demás tienen alma de lacayos, no van a renunciar: footman enjoy opres
====
Smart money
is getting the hell out of the city.
====
One death is nothing compared to the hundred killed under a
fascist regimen
CHAZ, CHOP,
or whatever you want to call it
has just
suffered its first fatality...
====
The Weimar regime didn’t
print too much fake money to get similar results: 20% GDP
$10.4
trillion in fiscal stimulus and $7.9tn in monetary stimulus - for a grand total
of 20.8% of global GDP, injected mostly in just the past 3 months!
====
Los ricos
saquean la Nación en complicidad con el Gbno y nunca les ponen handcuffs.
Even though the note was clearly
identified as pretend money, shop staff felt obliged to call the police...
====
Irony time:
Put there all members of the executive + Senate &
warmongers of the House then sink
"..gently used..."
….
YES.. gently sink it or gently blow it up.. then accuse the RU+ China communist IF not
enough reason to initiate WW3, put their families in this “vacation trip”.
It’s my favor to Penta-Nato clowns who still didn’t got a plan to use
Ch-Ind war. Mr POTUS is already fostering WW3,
you should not disappoint our Furer.
He can dismiss all of you ‘immediately’ as happen with US Attorney Berman. IF you want better suggestion ask Bolton, he
know better the dances in this circus
====
"...worried the
rally could become a'super spreader'
event and recommended it be postponed"
====
'The government
is likely to succeed in its case against the former National Security Adviser.'
====
Yes, we will see economic numbers go up and down over the coming
months, but a return to “the good
times” is not in the cards...
====
US-WORLD ISSUES (Geo Econ, Geo Pol & global Wars)
Global depression is on…China, RU, Iran search for State
socialis+K-, D rest in limbo
Beijing is
turning a blind eye...
====
Full-blown 'intercept war' developingas
for first time in recent memory the US has flown bombers this close to
Russia's far eastern territory...
====
SPUTNIK and RT SHOWS
GEO-POL n GEO-ECO
..Focus on neoliberal expansion via wars & danger of WW3
- 'Improper
Motives' Behind Berman's Firing, AG Barr 'Must Be Held Accountable', Speaker
Pelosi Says
----
----
NOTICIAS IN SPANISH
Lat Am search f alternatives to neo-fascist regimes &
terrorist imperial chaos
RT EN ESPAÑOL
Bolton dice: UK coopera con US para congelar depósitos
de oro de Ven en Banco UK https://actualidad.rt.com/actualidad/357334-bolton-reino-unido-encantado-cooperar-eeuu-congelar-oro-venezuela
Tres mueren un apuñalamiento masivo en un parque del
Reino Unido https://actualidad.rt.com/actualidad/357316-tres-muertos-heridos-apunalamiento-protetas-reino-unido
Teherán envía buque con alimentos a Caracas e inaugura
1er supermercado iraní en Ven https://actualidad.rt.com/actualidad/357325-teheran-envia-buque-alimentos-venezuela-inaugurar-supermercado
temblor de mag 4,2 sacude Oklahoma poco después de
un mitin de Trump en Tulsa https://actualidad.rt.com/actualidad/357345-sismo-magnitud-sacudir-oklahoma-mitin-trump
Presidente cubano recibe a médicos que combatieron
el coronavirus en Italia https://actualidad.rt.com/video/357335-presidente-cuba-recibir-medicos-combatir-coronavirus-italia
----
----
INFORMATION CLEARING HOUSE
Deep on the US political crisis: neofascism & internal
conflicts that favor WW3
- The Global Reset – Unplugged By Peter Koenig
- Get Rid of the Presidency By Matthew Stevenson
----
----
CROSS TALK https://www.rt.com/shows/crosstalk/
In this
episode of the Keiser Report, Max and Stacy discuss the congressional
testimony of US Federal Reserve Chairman Jerome Powell, who is warning about
the risk to the recovery he has printed. They look at the explosion of Zombie
companies on the US stock exchange and the largest pension fund leveraging up
to meet their 7 percent returns. In the second half, Max talks to bitcoiner
Stephen Cole about inflation and war. They also discuss the bitcoin vs gold
debate.
----
----
GLOBAL RESEARCH
Geopolitics & Econ-Pol crisis that leads to more
business-wars from US-NATO allies
----
----
DEMOCRACY NOW
Amy Goodman’ team
- Juneteenth: A
Celebration of Black Liberation & Day to Remember “Horrific System That Was
Slavery”
====
====
No hay comentarios:
Publicar un comentario