ND MAR 13 20 SIT
EC y POL
ND denounce Global-neoliberal
debacle y propone State-Social + Capit-compet in Eco
ZERO
HEDGE ECONOMICS
Neoliberal globalization is
over. Financiers know it, they documented with graphics
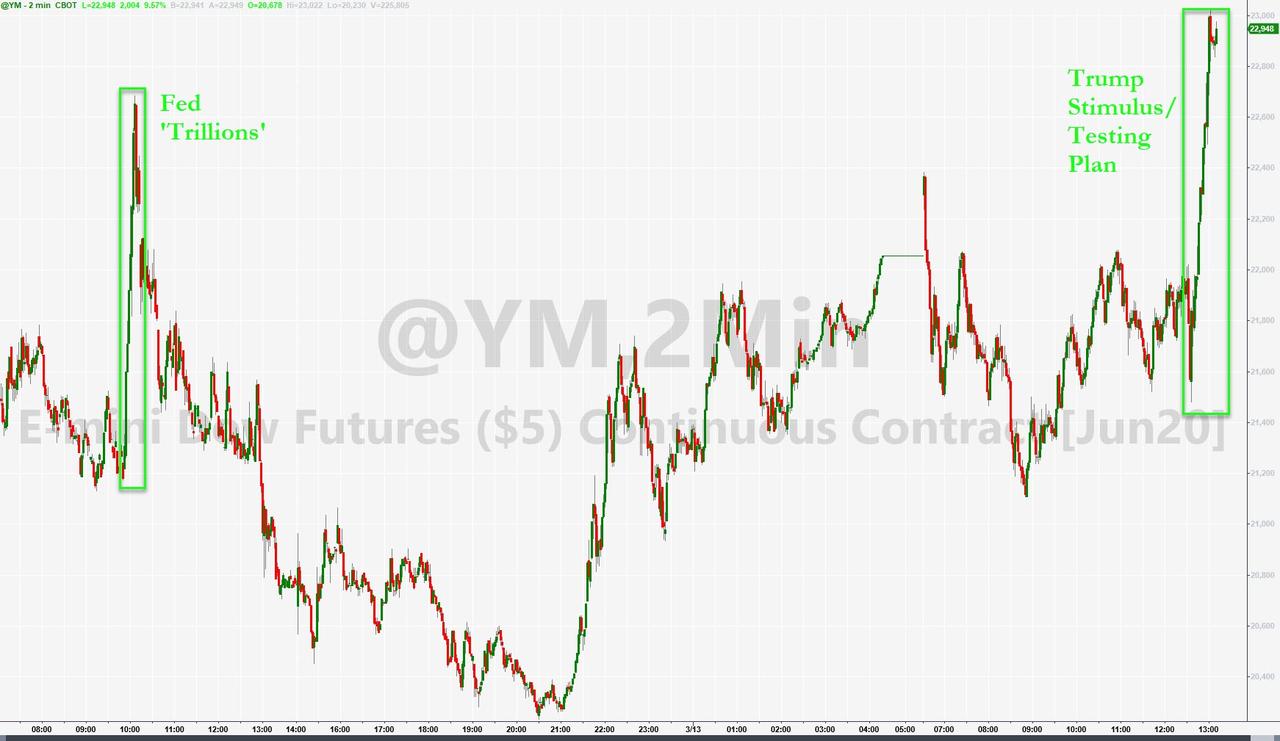
Today saw the biggest spike in US equities since
October 2008 after an avalanche of
intervention in the last 24 hours across the world and
extended by 1600 Dow points as Trump unveiled his stimulus/testing plan...
See Chart:
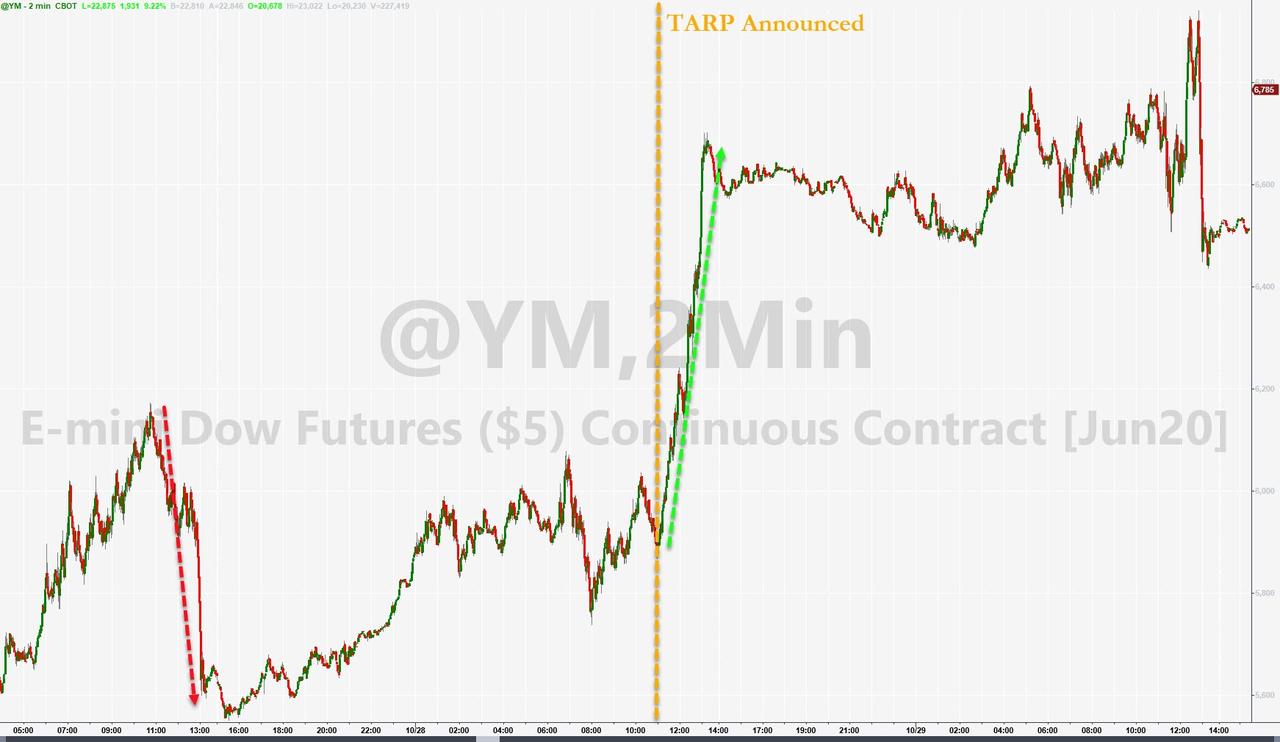
The last time the market rallied this much was
10/28/2008 - the day TARP was announced...
See Chart:
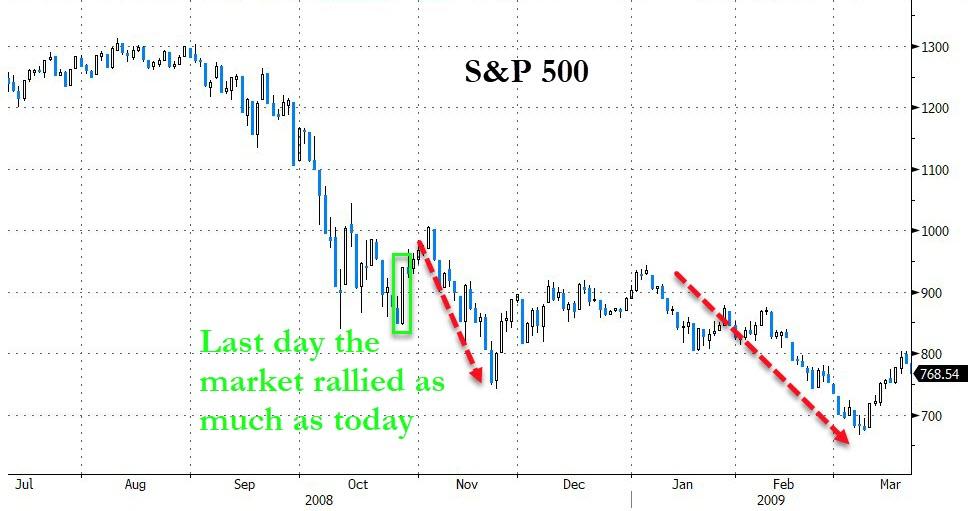
HOWEVER, THE S&P FELL 35% FURTHER AFTER THAT
TARP BOUNCE...
See Chart:
S&P 500
Last day the Market rallied as much as today
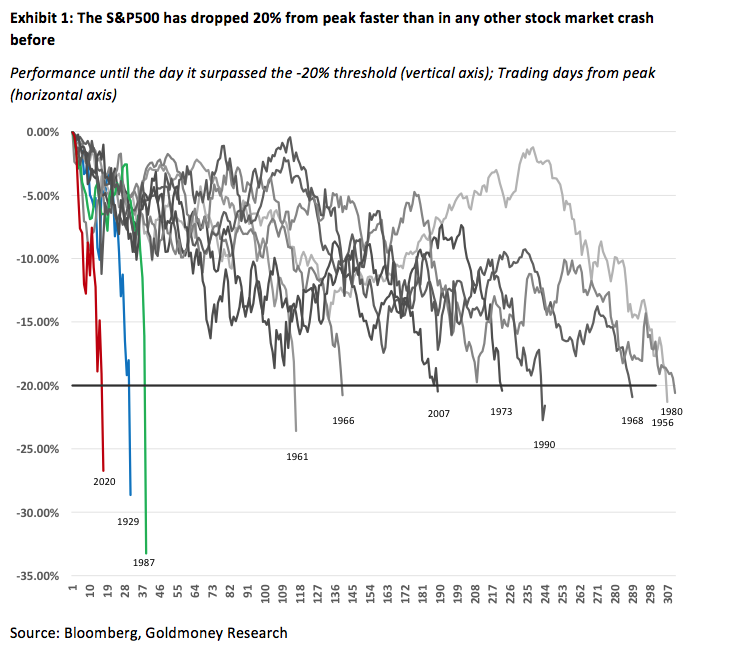
But, overall, the market just suffered its fastest,
most aggressive collapse into a bear market... ever...
See Chart:
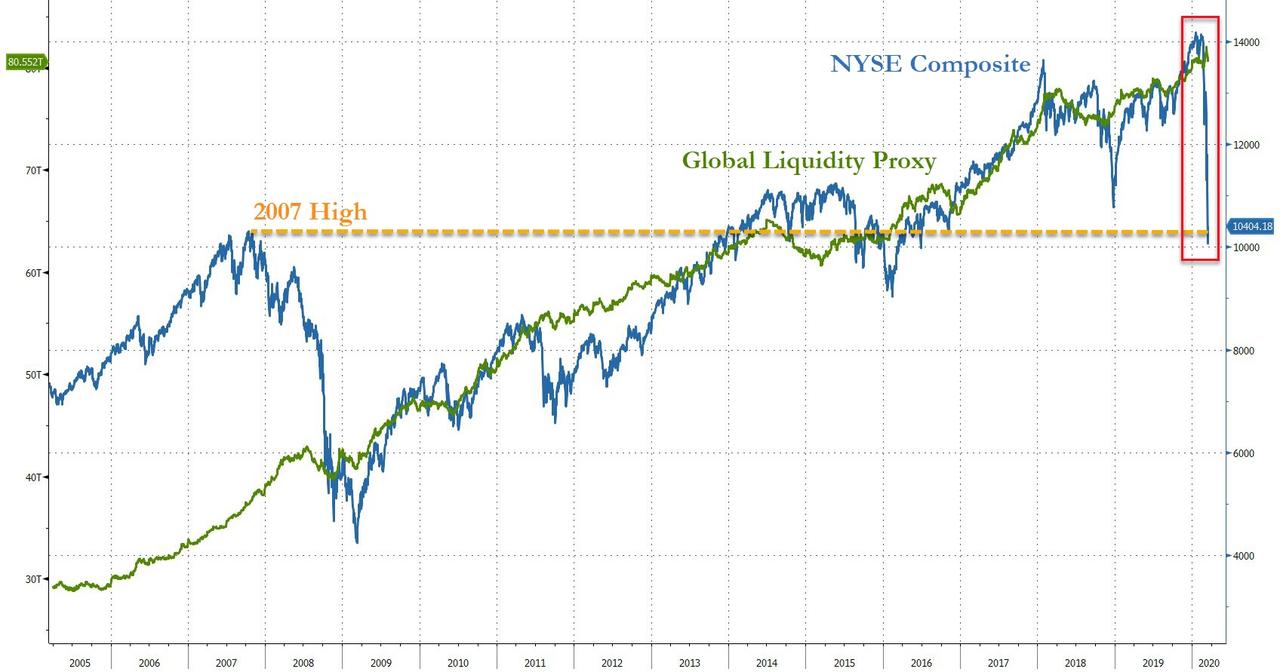
But even more ominously, the
broadest measure of the US equity market - The NYSE Composite Index - has collapsed below the
2007 highs (despite trillions in added liquidity)...
See Chart:
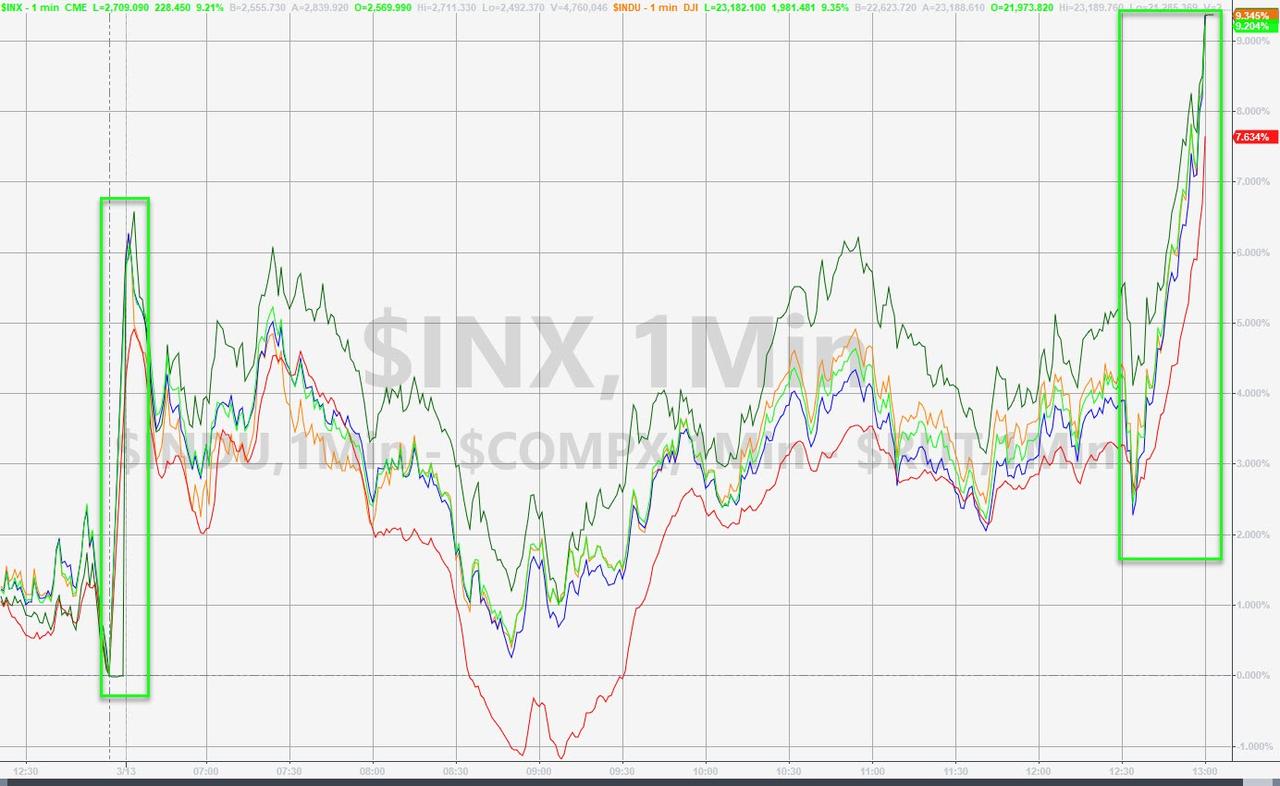
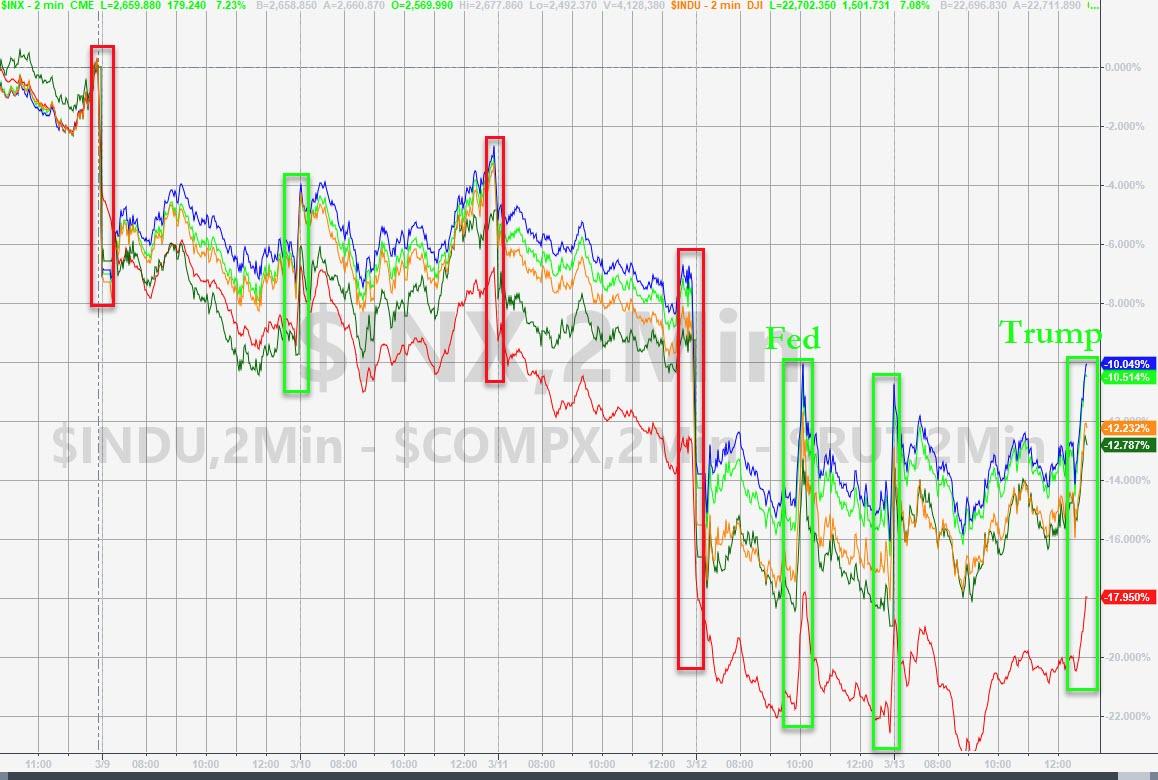
US equity markets ended the
week on a stronger note, big gains overnight (limit up in futures), a plunge at
the cash open, only to rebound when rumors hit that the President would declare
a National Emergency (implicitly some fiscal largesse) and when he announced
his plans, the market went vertical... this was the best day for stocks since 10/28/08...
See Chart:
This
was the market's worst week since Oct 2008, but Small Caps' 20% crash this week
is the worst since 1987 (Small Caps' 3-week plunge of 30% is the worst ever)
See Chart:
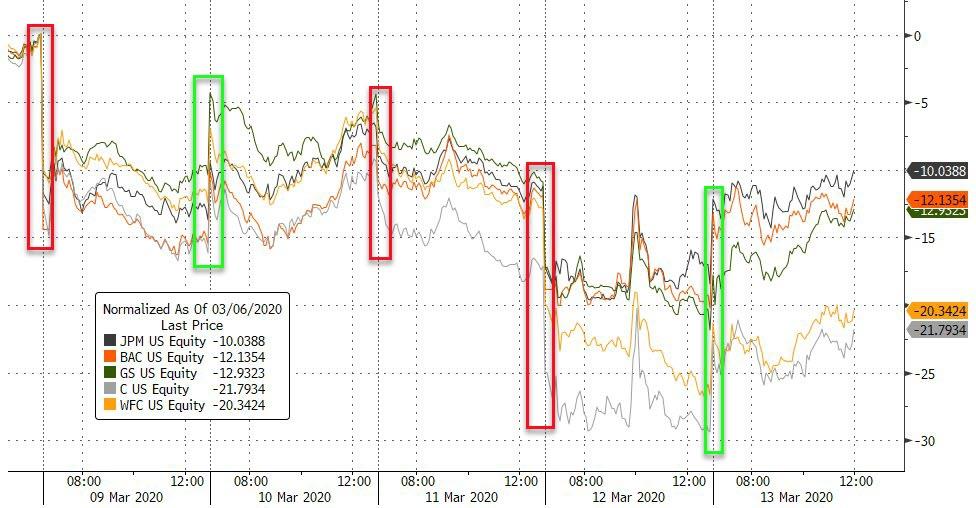
Banks
were battered (but bounced today)...
See Chart:
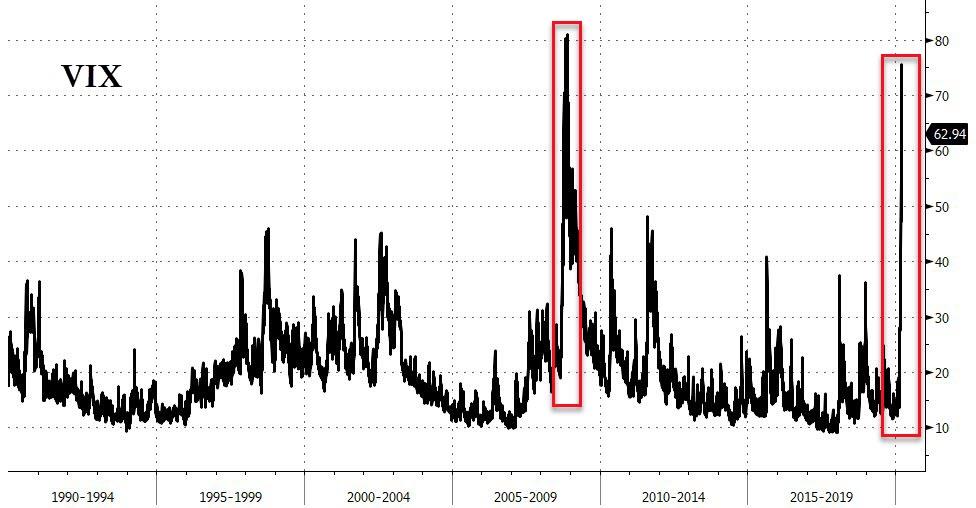
VIX
surged higher this week at an unprecedented pace, closing near record highs...
See Chart:
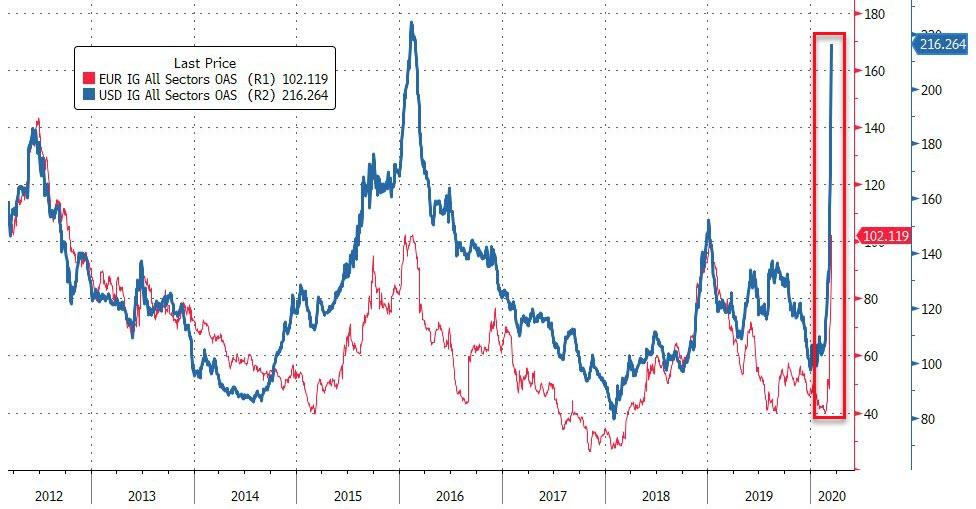
Investment
Grade credit crashed this week - by our record this is the biggest weekly spread
decompression in history...
See Chart:
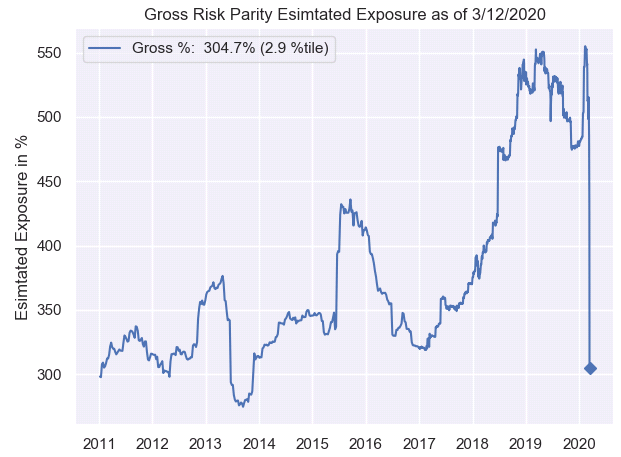
As
Risk-Parity Funds saw the biggest deleveraging losses in history...
See Chart:
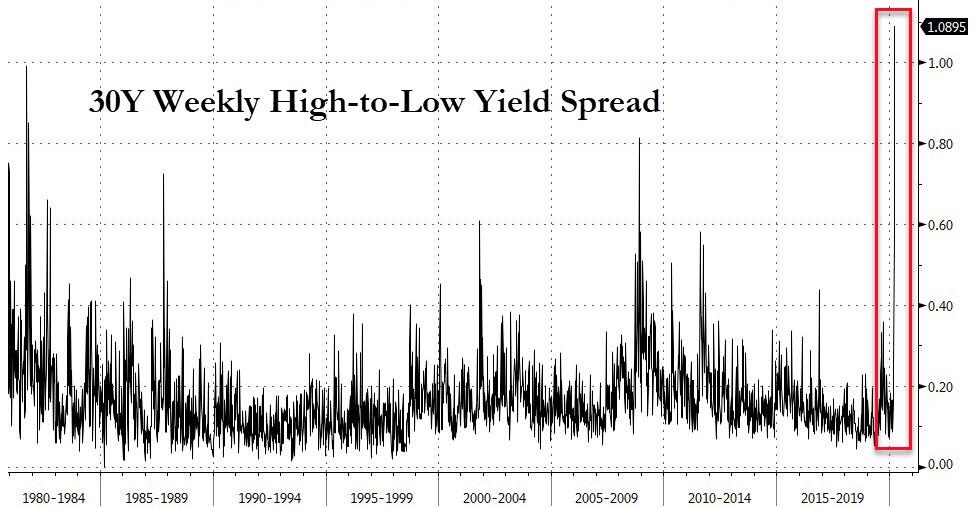
Bonds
suffered a total bloodbath this week - despite the collapse in stocks, with the
end of day seeing a melt-up in rates...
30Y yields exploded higher this
week after Sunday night's crash to record lows. Today saw 30Y spike to 1.79%
intraday before tumbling back to 1.39% on the Fed's
emergency QE today...
After
collapsing to 69bps on Sunday night/Monday morning, this week's blowout on
yields is the biggest ever...
But most worryingly, the Bond ETF world really
started to break as massive, unprecedented
discounts occurred in Treasury, Muni, and HY Credit ETFs exposing the
illiquidity of the underlying assets...
See Chart:
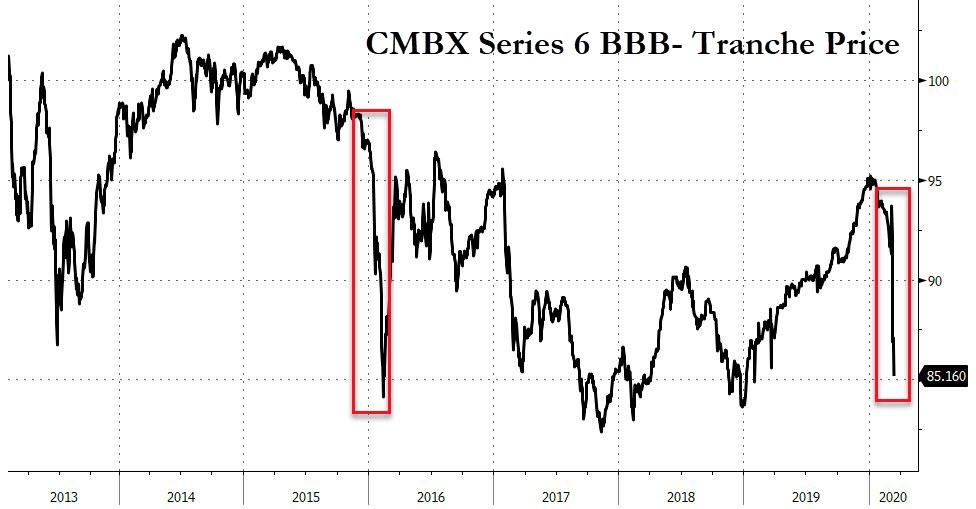
Before
we leave bond land, we note that CMBX
crashed back towards its lows
See Chart:
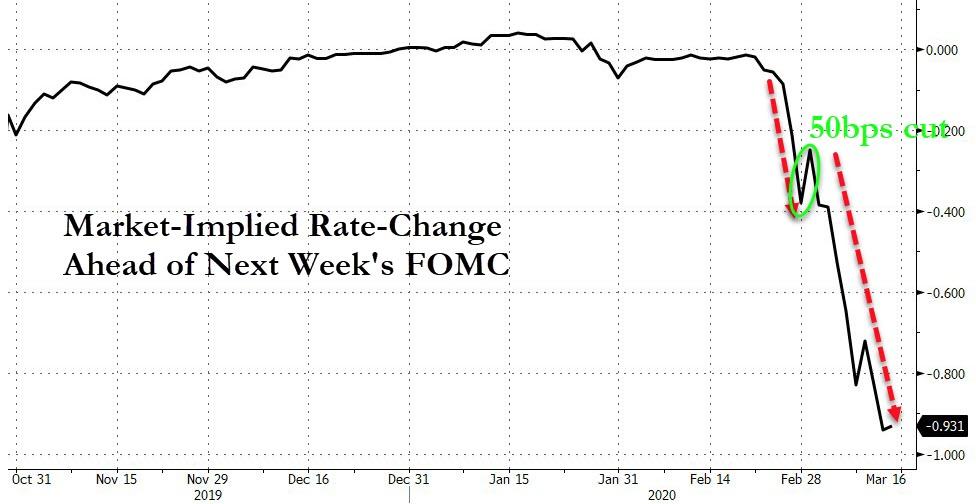
And the
market is now demanding practically 1 full percentage point cut in rates next
week by The Fed...
See Chart:
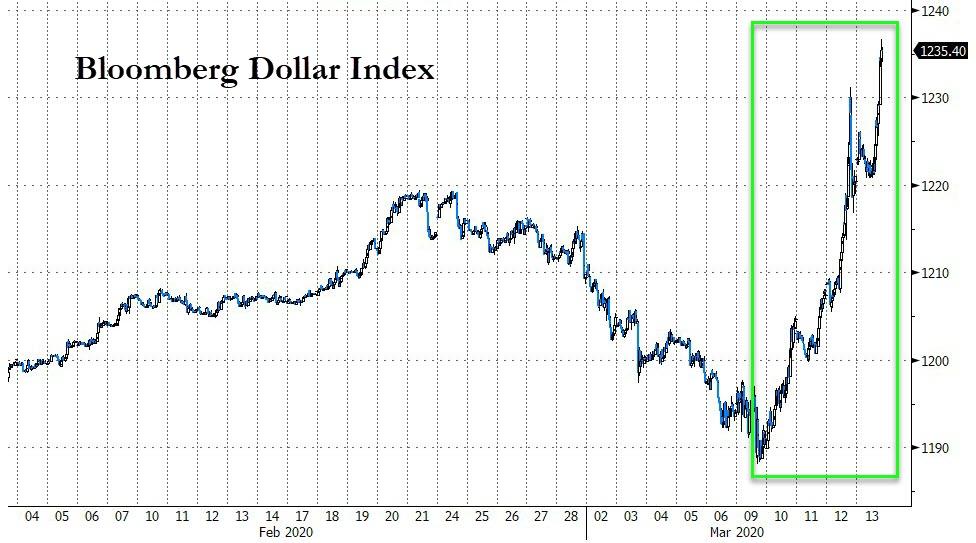
The B-Dollar
was massively bid this week as it appears key safe-haven flows - and liquidity
demands - sparked a 'sell-everything-else' trade worldwide... (3 days this week
were the biggest daily gains in the dollar since Nov 2016)
See Chart:
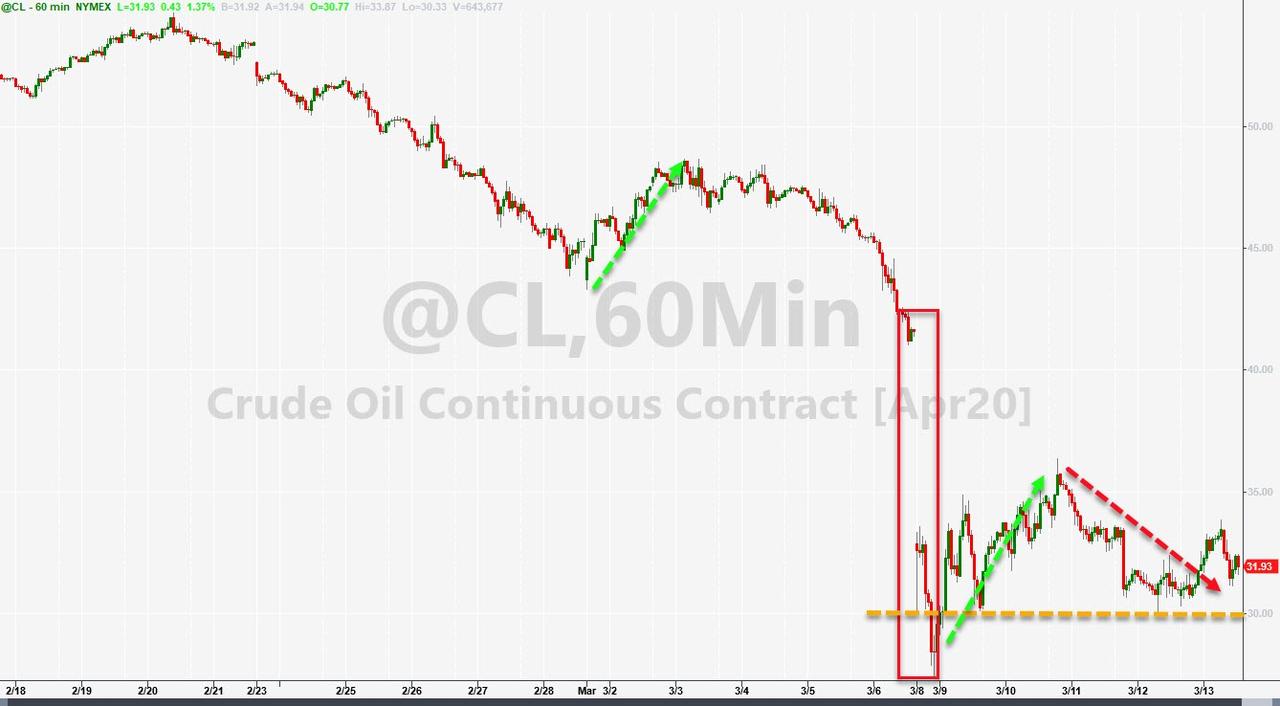
The
surge in the dollar this week did not help but commodities were clubbed like baby
seals as it seemed someone was mass liquidating everything in a scramble for
cash...
See Chart:
This
was WTI's worst week since Dec 2008 (and biggest 3-week drop ever)...
See Chart:
Finally,
this was the worst weekly loss for a 'diversified' book of bonds and stocks
since Lehman...
See Chart:
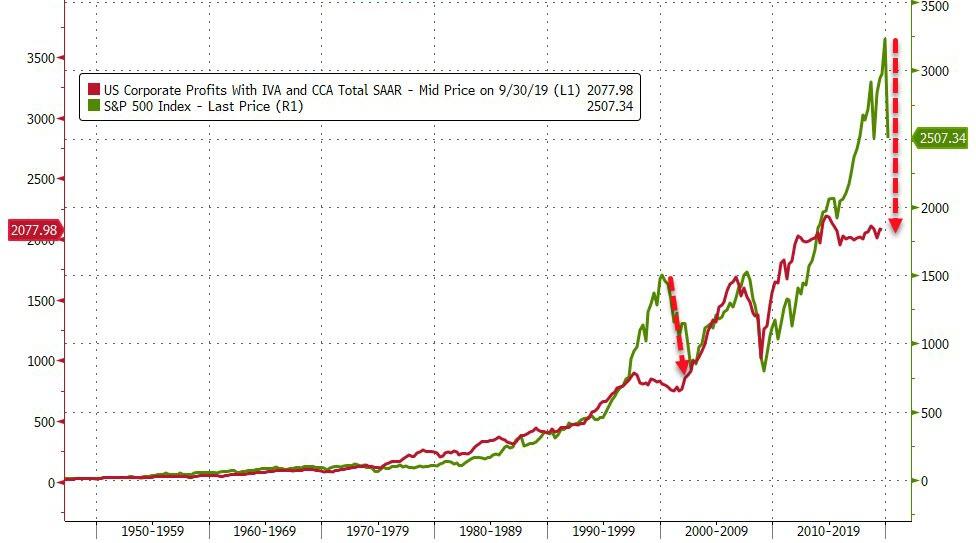
And, if you're wondering where this ends, it's
simple - below 2,000 for the S&P 500... as the last five years of equity
market gains have been total delusion...
See Chart:
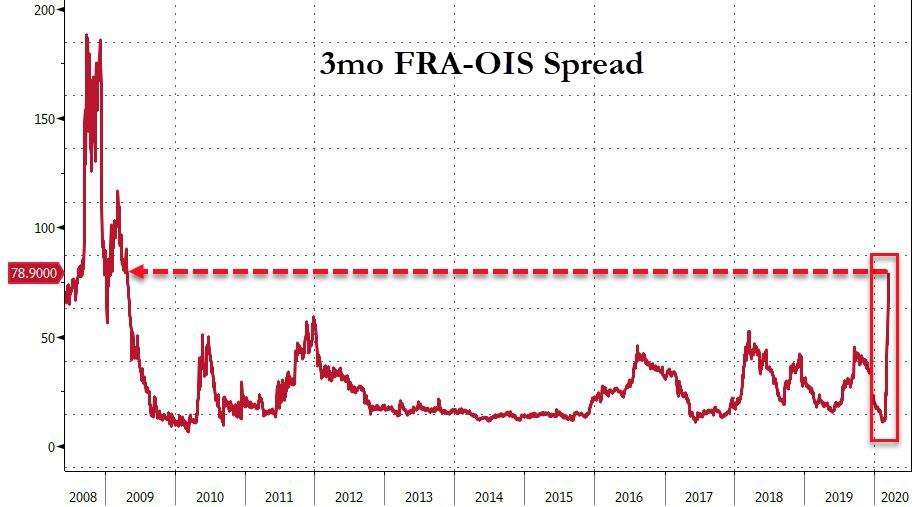
And if
you thought The Fed's Trillion-dollar-plus care-package helped... it didn't!
FRA-OIS spreads continued to blow out, strongly suggesting massive dollar
shortages and/or fear of systemic bank credit risks
See Chart:
….
----
----
"I’ve never seen that before,
the inability to trade a U.S. Treasury."
On the first day of this week,
which would soon mutate into the worst week for capital markets since the 2008
financial crisis, we warned that markets are about to go full tilt for the
simple reason that "there
is no liquidity", something we first highlighted at the start of the
month when we pointed out "Two
More Problems For The Bulls: Market Liquidity And Short Interest Are At All
Time Lows."
Why our constant focus on
liquidity? Because as Goldman explained on Thursday, "liquidity and
volatility are interconnected, creating a self-reinforcing loop, and as a
result liquidity conditions have been an important contributor to the velocity
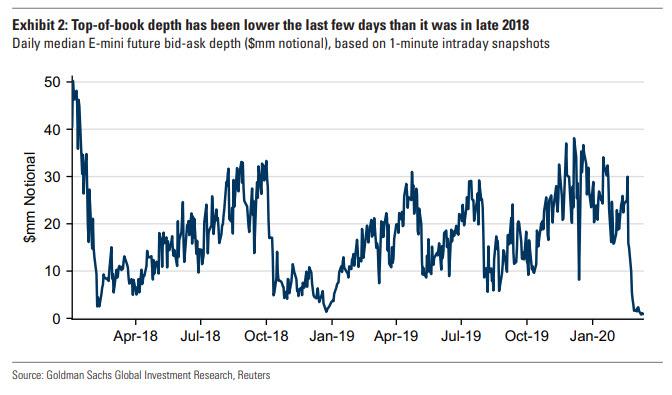
of recent S&P 500 moves." Typically the conventional metric of
liquidity representing the dollar-amount of SPX E-mini futures available to
trade electronically on the typically 25-cent wide market, has - as Goldman put
it - "started to
lose meaning as fewer and fewer market participants are quoting one-tick-wide
markets for the futures at all."
See Chart:
As Goldman further explained,
as volatility spiked, electronic futures liquidity has fallen to the point
where there has been a median of just 10 contracts, representing $1.5mm
notional, on the bid and ask of E-mini futures screens over the past week
(compared with a median of 120 contracts, representing $18mm notional, in 2019)…
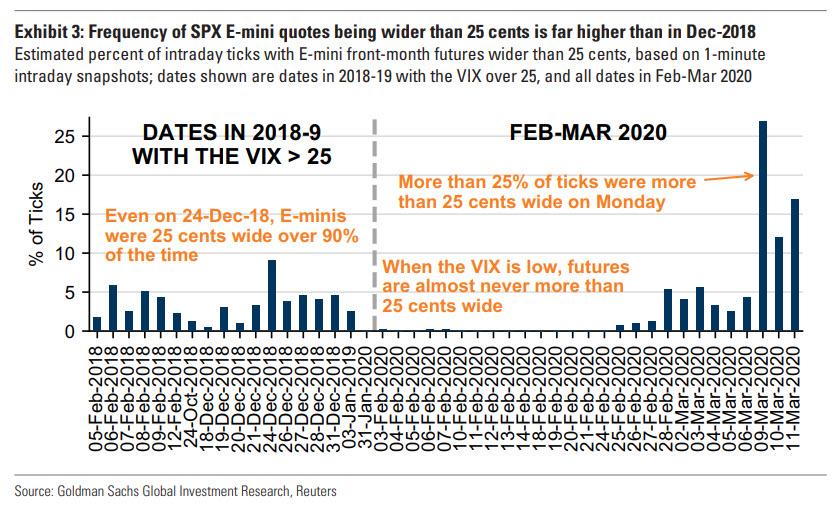
The key takeaway of diminished liquidity, however
measured, is that individual
trades can move markets more than they otherwise would have, leading to higher
volatility.
See Chart:
Frequency
of SPX E-mini quotes being widen than 25cents I higher than in Dec2018
A key
reason for the latest drop in liquidity has, curiously, been the concurrent
drop in trading volumes: SPX future and option volumes were materially lower
over the past week than they had been in the initial days of this market
downturn (although they were still high relative to normal periods).
See Chart:
Despite
having even higher volatility the last week has had lower index trading volume
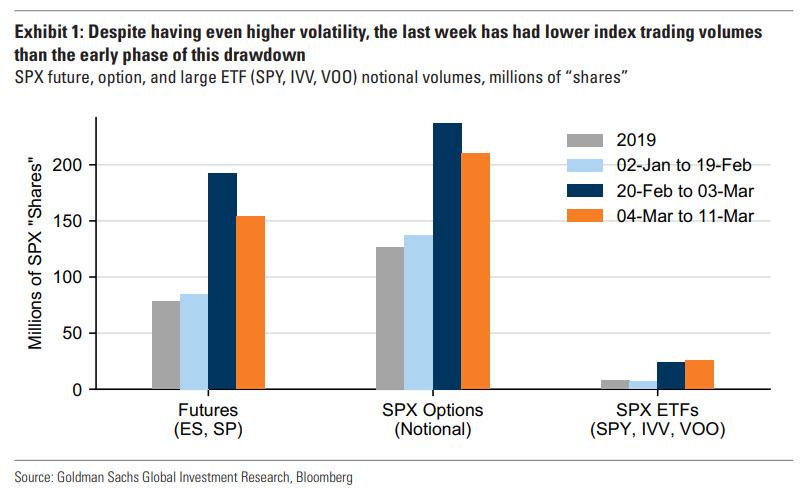
Continue reading up to you get
this conclusion:
Finally,
adding insult to injury, volatility - both for stocks and bonds - continues to
surge. The Bank of America Merrill Lynch MOVE Index, which measures price
swings in Treasuries, and the VIX both jumped to the highest levels since the
financial crisis.
See Chart:
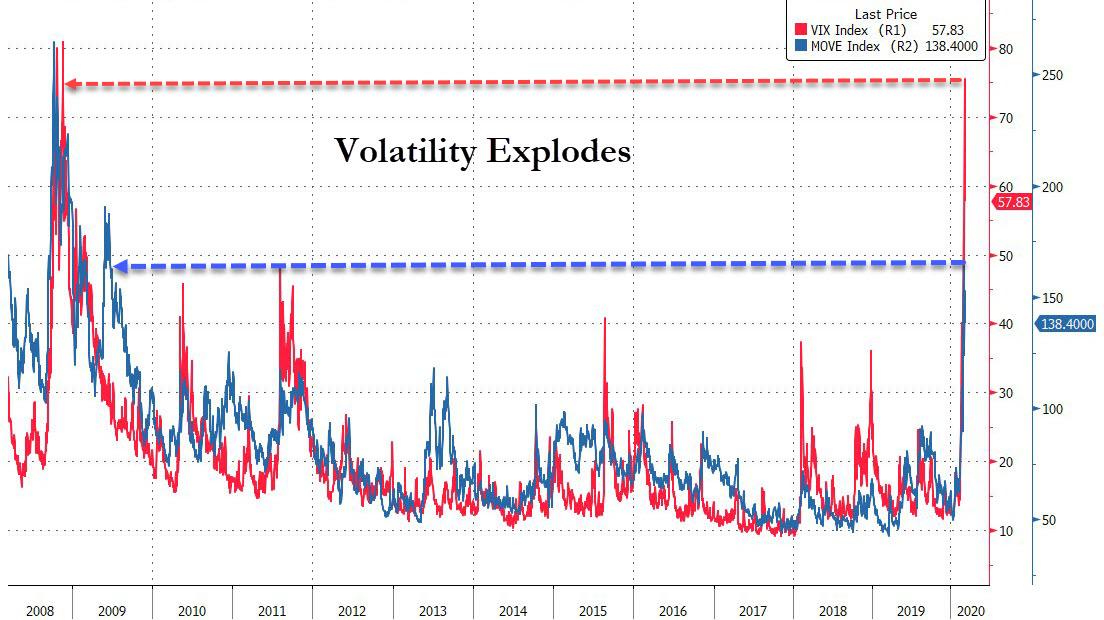
"We are at the stage where central banks need
to provide exceptional liquidity into the market to make sure that basic
markets can function."
“The Fed just cutting rates
again at this stage is really not the right medicine,” Li said."'The Treasury
market is broken -- with it being very illiquid. There’s very wide spreads between on- and off-the-run
spreads," and other signs of dislocation.
Let's
just hope Jerome Powell, who first diagnosed the real problem with the US
capital markets back
in 2012, knows how to fix them.
….
----
----
"The plunge in US equities
pushed weekly returns down to 7.7 standard deviations below the norm.... we can
say with confidence that we are witnessing a history-making market disaster in
real-time."
See CHART:
DJIA
WEEKLY RETURNS SINCE 1900 (Z SCORES)
Setting aside legitimate
quibbles over the statistical significance of this, we can say with confidence
that we are witnessing a history-making market disaster in real-time.
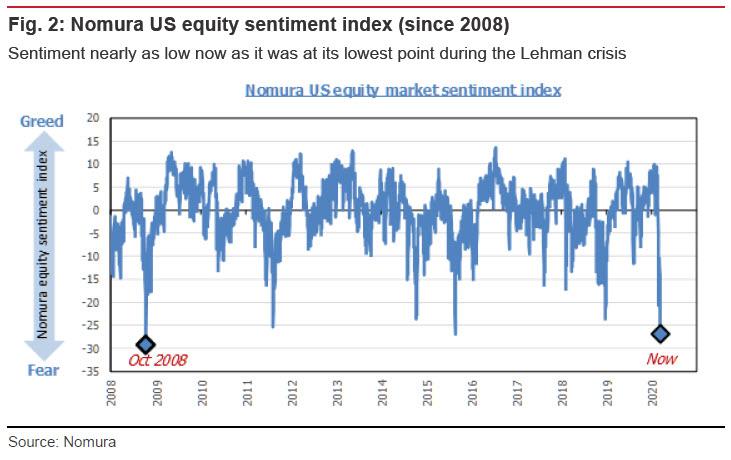
US stock market sentiment has also seen a jarringly swift collapse, as
equity sentiment has now gone beyond the low point marked during the 2015
renminbi shock. In
little more than the blink of an eye, the situation has come to look like the
2008 Lehman Brothers crisis all over again.
See Chart:
Nomura US Equitty
sentiment index (since 2008)
https://www.zerohedge.com/s3/files/inline-images/nomura%20sentiment%20index%203.13.jpg?itok=HPeEQ8i8
Continue reading the best
description of our Economic collapse before arriving to this conclusion:
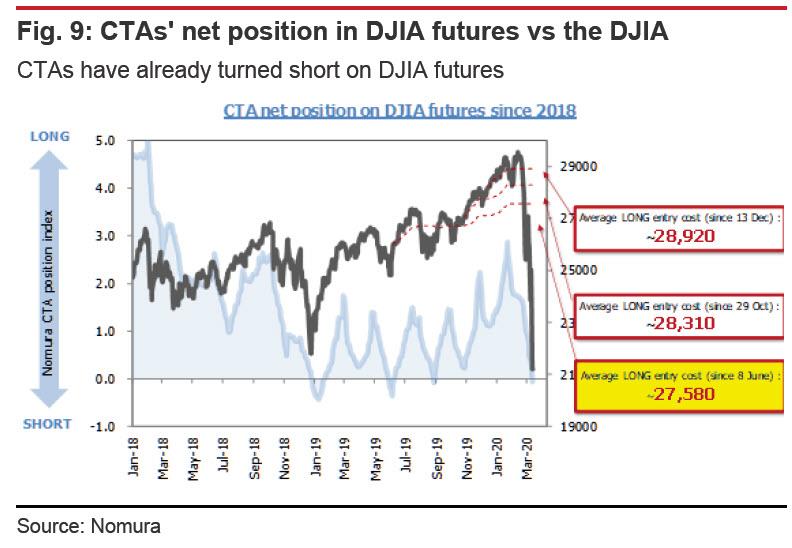
CTAs have turned short on DJIA futures. Because of the rapid pace of
the Dow's drop, CTAs have been able to build sufficient short positions. As
they had already preferred short positions with the DJIA below 28,000, CTAs look likely to build short positions rapidly at current
share price levels.
See Chart
CTAs
have already tuned short on DJIA Futures
It may be, then, that
the market has only just begun staring into the abyss.
….
SOURCE: https://www.zerohedge.com/markets/77-sigma-move-nomura-says-market-has-only-just-begun-staring-abyss
----
----
SHORT NEWS on ECONOMICS:
Never
forget that there’s a fool on
every corner and a sucker born
every minute.Avoid being one of them
when at all possible...
====
====
Even as stocks surge, the interbank
funding market is approaching a state of total paralysis. Unless this is fixed,
and soon, total systemic collapse may follow.
====
This week’s unprecedented moves are
more about investors responding to the biggest VaR shock since the Lehman
crisis.
See Chart:
====
US DOMESTIC POLITICS
Seudo democ duopolico in US is
obsolete; it’s full of frauds & corruption. Urge cambio
Legislation would allow carriers to arrive in
US unimpeded...
====
US-World
ISSUES (Geo Econ, Geo Pol & global Wars)
Global depression is on…China,
RU, Iran search for State socialis+K-, D rest in limbo
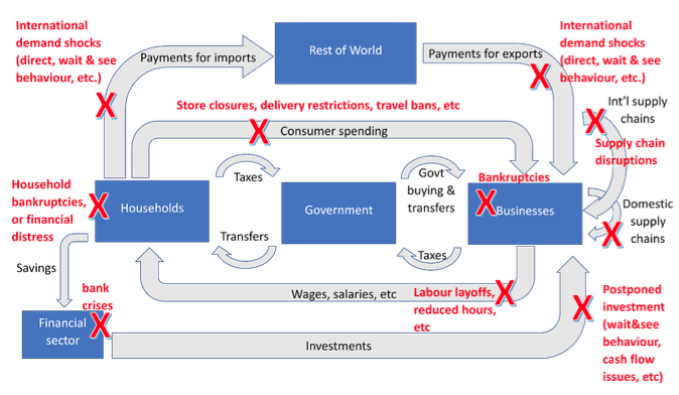
The
COVID-19 crisis has struck the
economic ‘machine’ in several placesat the same time...
See Chart:
====
Siding with CCP propaganda?
====
Iraqi officials outraged over
Thursday airstrikes on Iran-backed militias, citingnational troops killed and wounded.
====
SPUTNIK
and RT SHOWS
GEO-POL n GEO-ECO ..Focus on neoliberal expansion via wars
& danger of WW3
----
----
NOTICIAS
IN SPANISH
Lat Am search f alternatives to
neo-fascist regimes & terrorist imperial chaos
REBELION
====
ALAI ORG
----
----
COUNTER
PUNCH
Analysis on US Politics &
Geopolitics
Craig Collins Civilizations Won’t Decline: They Collapse
Michèle Brand Class
Conflict is Stronger than Clan Conflict
Marshall Auerback Coronavirus
Reveal Cracks in Globalization
Joseph Natoli A
Machine to Beat President Trump
Nomi Prins The
Fed, the Virus, and Inequality
Alice Slater The
Virus of Nuclear Proliferation
----
----
GLOBAL
RESEARCH
Geopolitics & Econ-Pol
crisis that leads to more business-wars from US-NATO allies
----
----
DEMOCRACY
NOW
Amy Goodman’ team
----
===
No hay comentarios:
Publicar un comentario