ND SEP 30
19 SIT EC y POL
ND denounce Global-neoliberal
debacle y propone State-Social + Capit-compet in Eco
ZERO HEDGE ECONOMICS
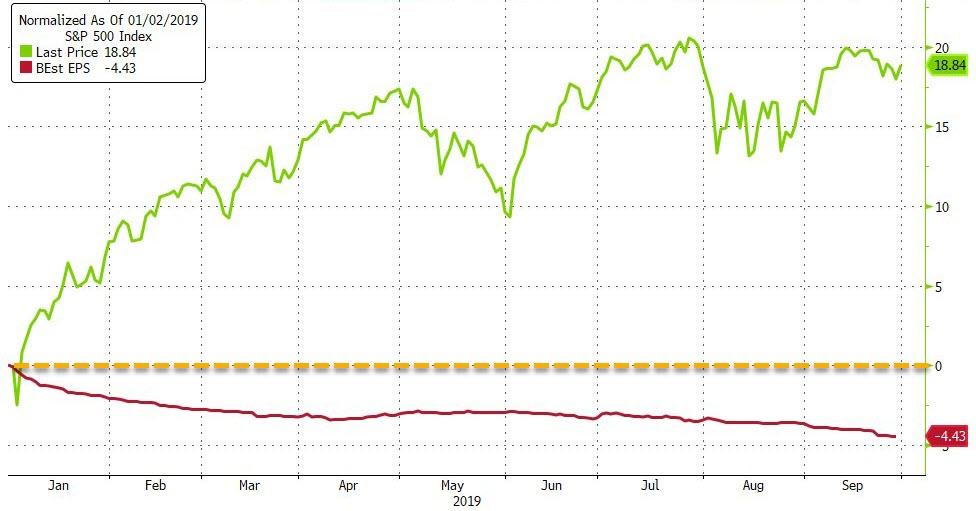
Neoliberal globalization is
over. Financiers know it, they documented with graphics
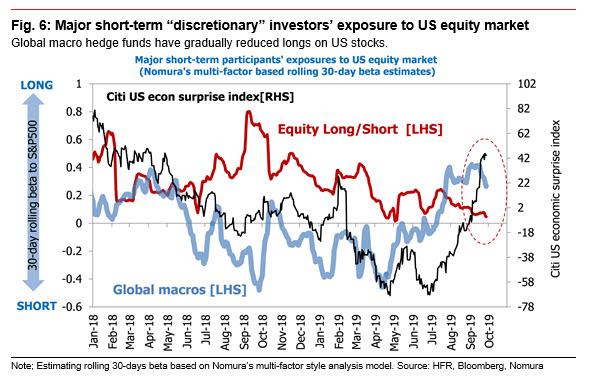
"with other hedge funds buying
stocks at a slower pace now, we think conditions could soon prompt CTAs to
begin paring their net long positions in S&P 500 futures and DJIA
futures."
See Chart:
Citi US
Econ Surprise Index (RHS)
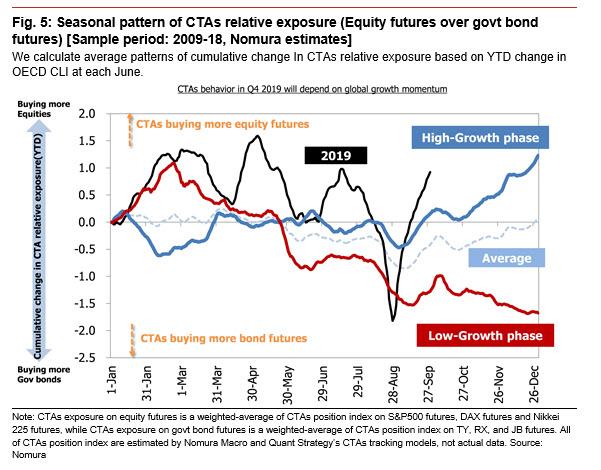
CTAs
buying more equity futures
See Chart:
CTAs have only recently started
to shift their asset allocation away from bonds toward stocks, and there is a
widely held bullish view that sees them continuing to add to their equity
exposure through the end of the year, which is why a
key question when deciding how stocks will trade in Q4, is whether CTAs will continue increasing
equity exposure and reducing their bond exposure through the end of the year.
See Charts:
CTAs
Relative exposure (Equity futures vs
Govt bonds futures (Nomura estimates)
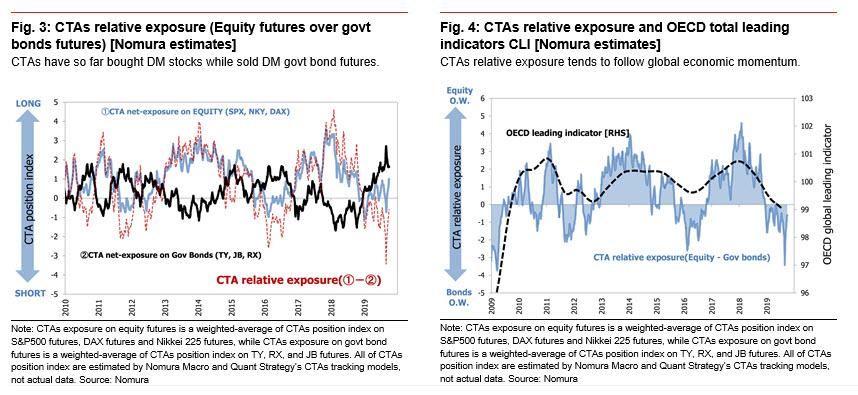
….
See
More Charts at:
----
----
RELATED: UNCERTAINTIES
(mistakes + anything could happens)
"... one question we are often
asked by our clients is about the similarities and differences to last
year."
So, without further ado, in
terms of similarities to last year, JPMorgan - just like Morgan Stanley - sees
several:
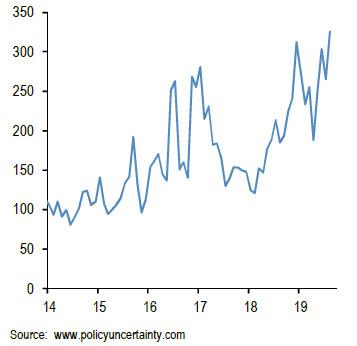
1) Continued weakness in global manufacturing and
elevated uncertainty as trade war risks and concerns about late cycle dynamics
in the US continue to hit business confidence. This is shown
by Figure 1 which depicts a global uncertainty proxy constructed by Baker,
Bloom and Davis (www.policyuncertainty.com).
To a large extent, their proxy quantifies newspaper coverage of policy-related
economic uncertainty as well as disagreement among economic forecasters. Not only does this uncertainty proxy remain elevated but its
current level is even higher than that seen in September 2018.
See Chart:
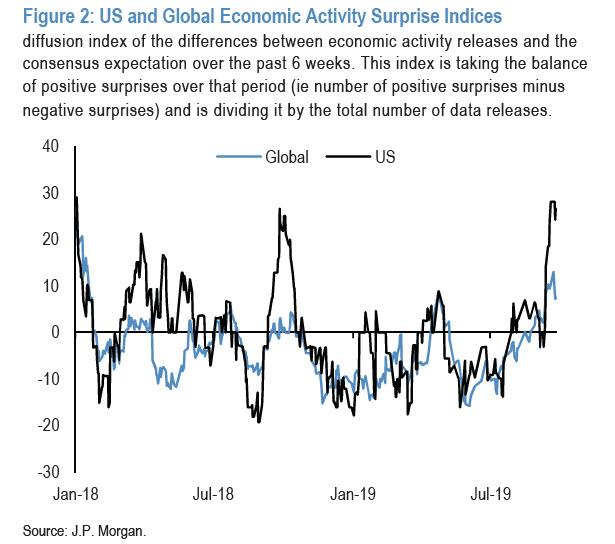
2) US economic growth outperformance relative to
the rest of the world. This is shown by Figure 2 which
depicts JPM's Economic Activity Surprise Index (EASI) for the US. This index captures the difference between US economic
activity releases and the consensus expectation over a six-week rolling window.
The level of the index stands at pretty high levels at the moment, very similar
to the highs seen a year ago in September 2018, suggesting that US economic
activity indicators have been surprising consensus expectations predominantly
positively over the past weeks. But similar to last
year, the very high level currently creates the risk of mean reversion, i.e.
the risk that US economic activity surprises turn less positive into year end.
See Chart:
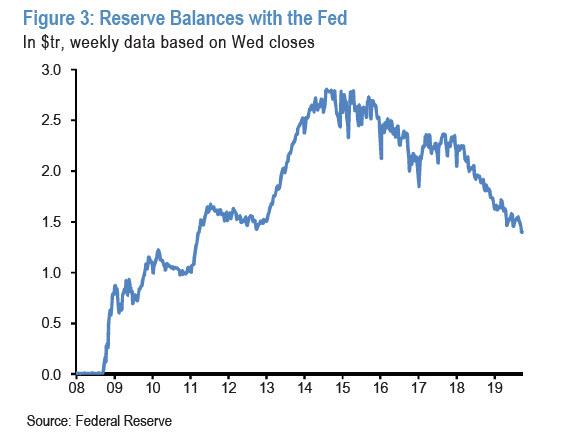
3) A strong dollar helped not only by US economic
growth outperformance by also a shortage of dollar cash. This
shortage is reflected by the reserves balance at the Fed. This reserves balance
remains low at close to $1.4tr despite the temporary injections of liquidity
via overnight and 14-day operations by the Fed. In particular, the temporary
$105bn injection of liquidity via the Fed’s repo operations in the two weeks
from Sep 11th to Sep 25th has only partially offset the increases in the
Treasury’s General Account, with reserves declining from $1459bn to $1427bn
(Figure 3). This tightening, along with the
relative macro surprises, has likely helped to push the dollar higher over the
past two weeks.
See Chart:
Reserve
Balances with the FED
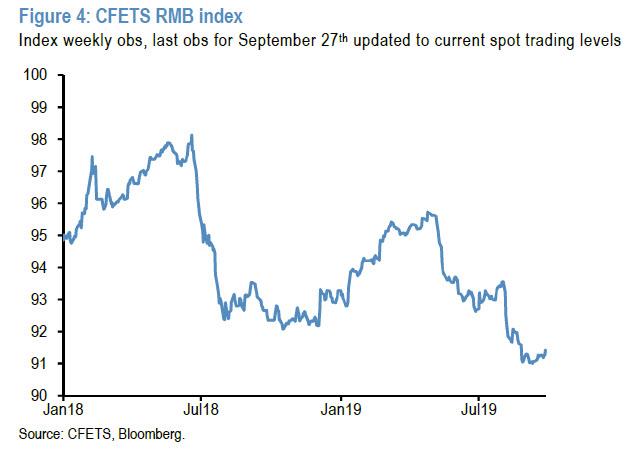
4) While China has delivered stimulus through a
number of channels to mitigate the impact of the trade conflict, it has also
exported some of slowdown to the rest of the world via currency
depreciation. The depreciation seen in the Chinese currency
over the summer months is similar in magnitude to the depreciation seen in the
summer of 2018 preceding the Q4 2018 risky market correction. This is shown in
Figure 4 via the CFETS trade-weighted index for the Chinese renminbi as
produced by the People’s Bank of China. This trade-weighted index was
introduced at the end of 2015 in an attempt by the central bank to discourage
investors from exclusively focusing on the yuan’s fluctuations against the
dollar. The CFETS index lost close to 5% since the end
of April, similar in magnitude to the 6% correction seen between June and
September 2018.
See Chart:
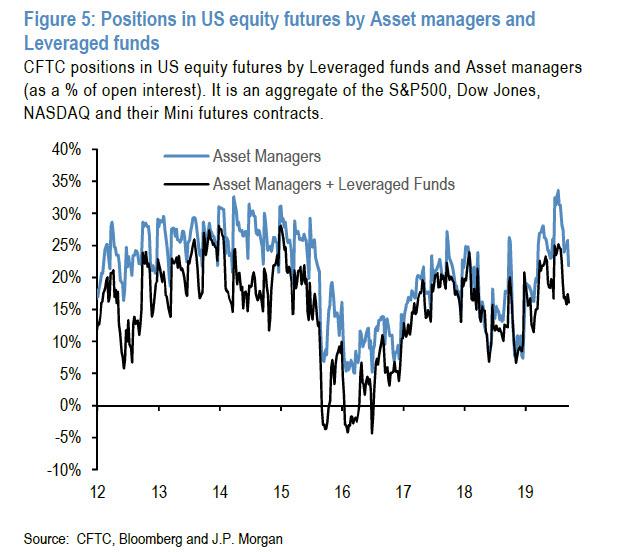
5) US equity futures positions by Asset Managers
and Leveraged funds are as high as they were in September 2018 leaving equities
vulnerable. This is shown by
Figure 5.
See Chart:
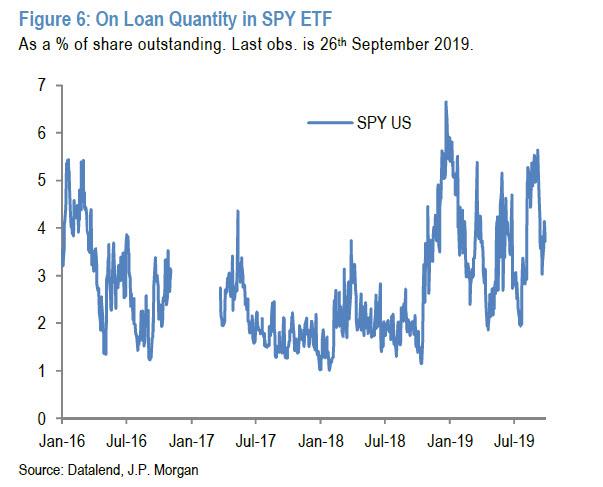
6) JPM's short interest proxy for the SPY US
Equity ETF, the biggest equity ETF in the world and a popular vehicle to
express short positions by institutional investors, is currently far from very
high or capitulation levels, as it was the case in September 2018 (Figure
6). But Figure 6 shows that there is also a difference. Relative to September
2018, the current level of this short interest proxy is more elevated than its
level seen in September 2018 suggesting that there is
currently a higher short base in US equities than the one existing in September
2018, even if this metric is far from the capitulation levels of December 2018.
See Chart:
7) Momentum traders such as CTAs are long
equities enough to amplify a potential down move in equities as they did in Q4
2018. JPM's momentum signal for US equity futures is not as
high as it was in September 2018, when the z-score stood at 1.0 stdev (Figure
7). But at 0.5 stdevs currently this momentum signal is still positive enough
to amplify any potential downmove triggered by other types of equity investors
as in Q4 2018. Figure 7 shows that at the time the momentum signal for the
S&P500 index swung from +1 stdev in September to -1 stdev by December. A
similar 2 stdevs swing could happen in the current conjuncture.
THAT SAID, THERE ARE ALSO DIFFERENCES BETWEEN THEN AND
NOW.
One key difference with September
2018 is that trend-following investors such as CTAs are
long equities across all regions while in September 2018 they were long in US
and Japanese equities but neutralized in European and EM equities. At
the time, this had helped EM and European equities to outperform US equities
during the Q4 2018 correction. This time such
differentiation across regions looks less likely if an equity correction takes
place into the end of the year.
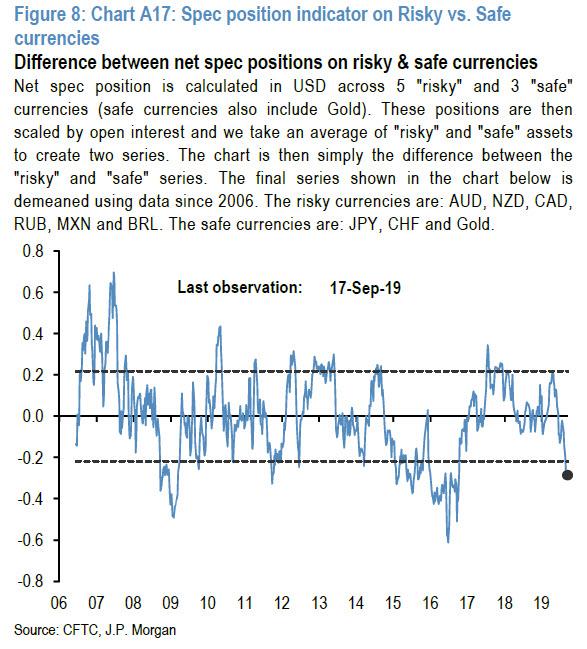
What about other differences
beyond the two differences mentioned above in sections 6) and 7)? One other difference is in the currency space. Figure
8 shows that risky currencies such as EM and commodity currencies look oversold
relative to safe currencies, i.e. JPY, CHF and Gold. This
implies that any downside in risky currencies and any upside in safe currencies
would be more limited this time relative to the experience of Q4 2018.
See Chart:
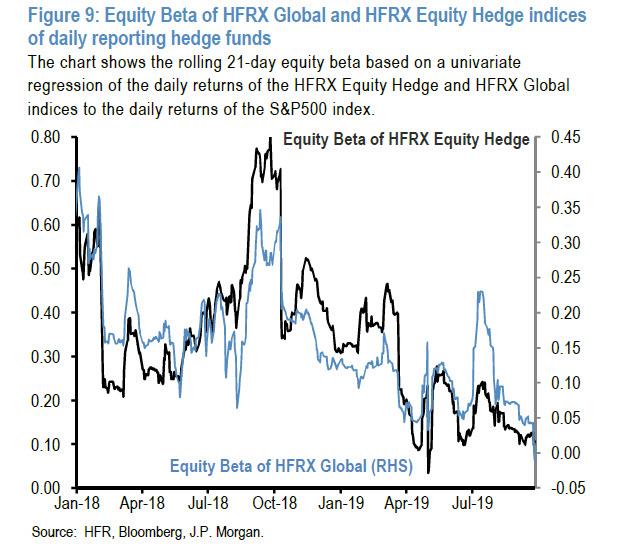
Another apparent difference to last year is the
equity exposure of daily reporting hedge funds. This is shown by
Figure 9 which depicts the 21-day rolling equity beta of HFRX Global Hedge Fund
index. At face value, this suggests that hedge funds are pretty underinvested in equities
relative to a pretty overweight positions in September 2018. But there are two problems with
this interpretation.
The
first problem is that hedge funds is less global than is often perceived
and is dominated by daily reporting Equity Long/Short hedge funds. Therefore, the JPM quant believes that the picture in
Figure 9 is more representative of Equity Long/Short hedge funds rather than
the overall hedge fund universe.
A
second problem is that this year there has been significant divergence
between the HFRX index of daily reporting Equity Long/Short hedge funds and the
HFRI index of monthly reporting Equity Long/Short hedge funds. The daily
reporting Equity Long/Short hedge funds exhibited low equity betas for most of
the year as shown in Figure 9. However, the much bigger in terms of AUM universe of monthly reporting
Equity Long/Short hedge funds is sending a different message: their most recent performance for August
implies an above average rather than below average
equity exposure casting doubt to the message implied by Figure 9.
See Chart:
But there is no doubt that the most important
difference to last year is that central banks are now easing policy via both
rate cuts and quantitative measures rather than tightening which was the case
during 2018. And this is an important difference as it suggests
that central banks are supporting equity and credit investor sentiment rather
than acting as a headwind. This supportive central bank policy also means that
bond yields are much lower today that they were a year ago making investors
more OW fixed income and thus less OW equities than they were last year.
This is shown by Figure 10,
Figure 11 and Figure 12 which show the implied bond, equity and cash
allocations of non-bank investors globally. Figure 10 implies that investors
are currently very OW bonds, the most OW since the beginning of 2016, a big
contrast to the very UW bond position they held in September last year. There
are two implications from this big bond OW. The first implication is that
investors are less OW equities currently than in September 2z018 (Figure 11). The second
implication is that investors are the most UW cash they have been since 2007
(Figure 12), suggesting that at the aggregate level there is little
cash sitting on the sidelines.
See Charts:
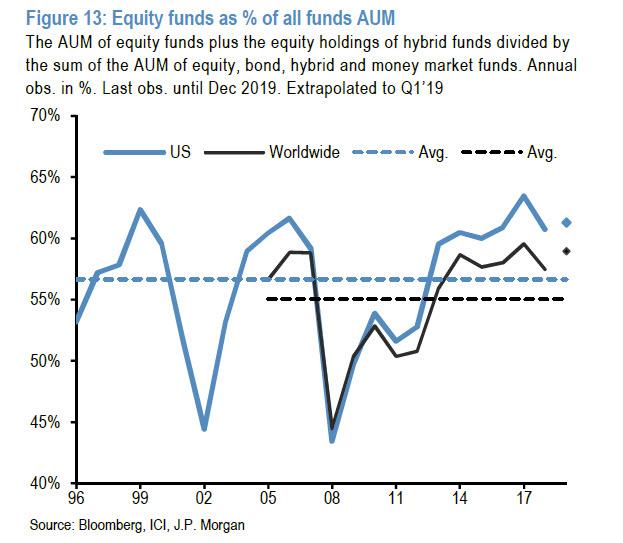
But the picture above faces
challenges: although lower that in September
2014, the current implied equity
allocation of investors globally is still pretty high relative to the post
Lehman history. This
is especially true for retail investors which at 60%, their equity fund share
globally is not far from previous record highs (Figure 13). This big equity OW explains why retail investors have
been heavy sellers of equity funds and heavy buyers of bond funds this year, as
they struggled to prevent their equity OWs from rising too much due to
the 15% rally in global equities.
See Chart:
Finally,
and perhaps most controversially is Panigirtzoglou's assertion that "the idea that
central bank policy will prevent an equity correction faces challenges also." As he further explains,
if central banks’ rather reluctant easing disappoints demanding market
expectations going forward, "there is a risk that
investors begin to cover their cash UWs depressing both equity and bond
prices." And then there is the nuclear
scenario: if investors’ concerns over the marginal efficacy of further central
bank stimulus in the absence of any significant fiscal stimulus grow from here,
particularly in the face of further escalation in trade conflicts, central bank easing may fail to
bolster investors’ confidence that a more serious cyclical downturn can be
prevented. Also, central bank easing may turn out to be too little too late to if the dynamics of a more
serious cyclical downturn or recession are already taking hold: "After all, economic variables alone continue to point to
persistently high probability of a US recession at close to 45%, higher than it
ever got in 2016 both in terms of magnitude and persistence", the
JPM quant ominously writes.
In conclusion, while the
JPMorgan strategist acknowledges that at the moment
investors equity exposures are overall lower than in September 2018,
But "they
are not low enough to prevent an equity correction from happening."
And while central banks are easing this year relative to the tightening they
inflicted in 2018, "the idea that central banks
easing can prevent an equity correction form taking place is facing several
key, and increasingly growing challenges."
….
----
----
US ECONOMIC DISASTER:
A
flip-flopping quarter ended with global
stocks flat but global bond yields collapsing...
See Chart:
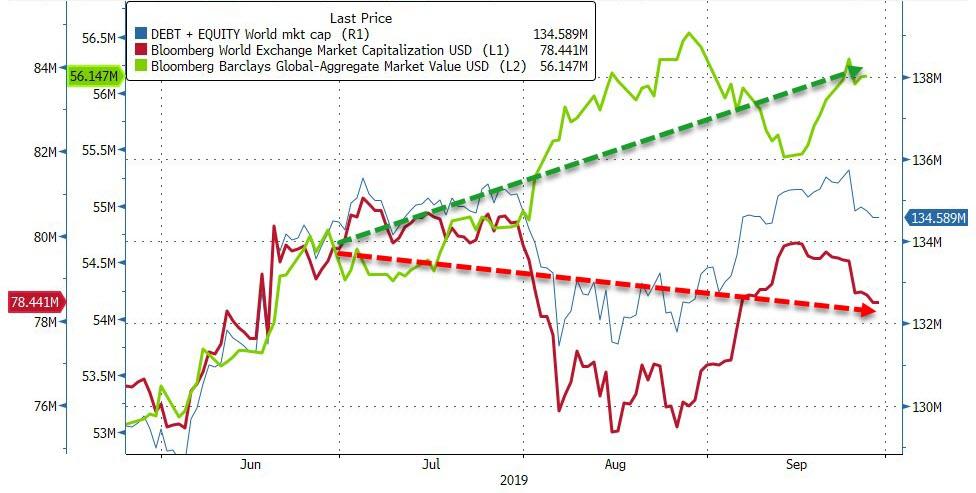
Global equity and bond market
values rose $1.23 trillion in September but ended Q3
little changed as stocks lost 1.25
trillion and bonds gained $1.8 trillion...
See Chart:
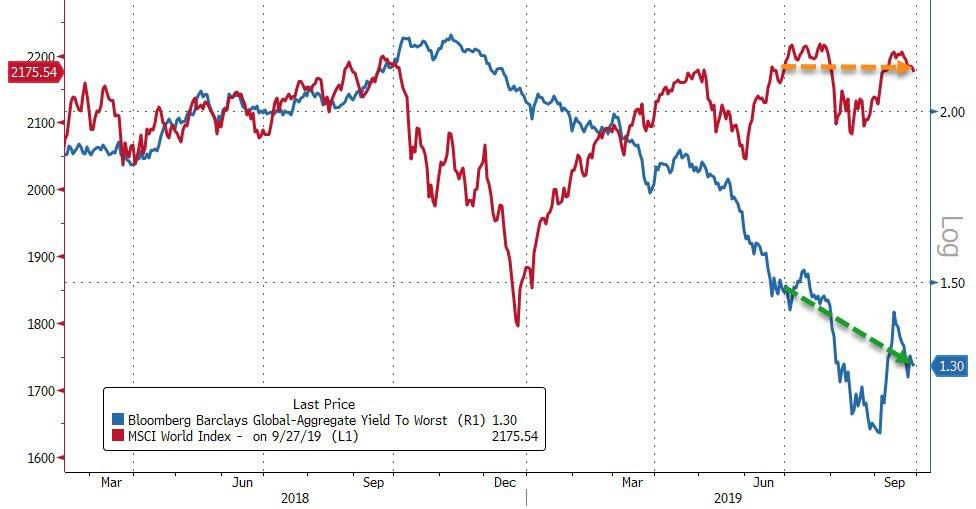
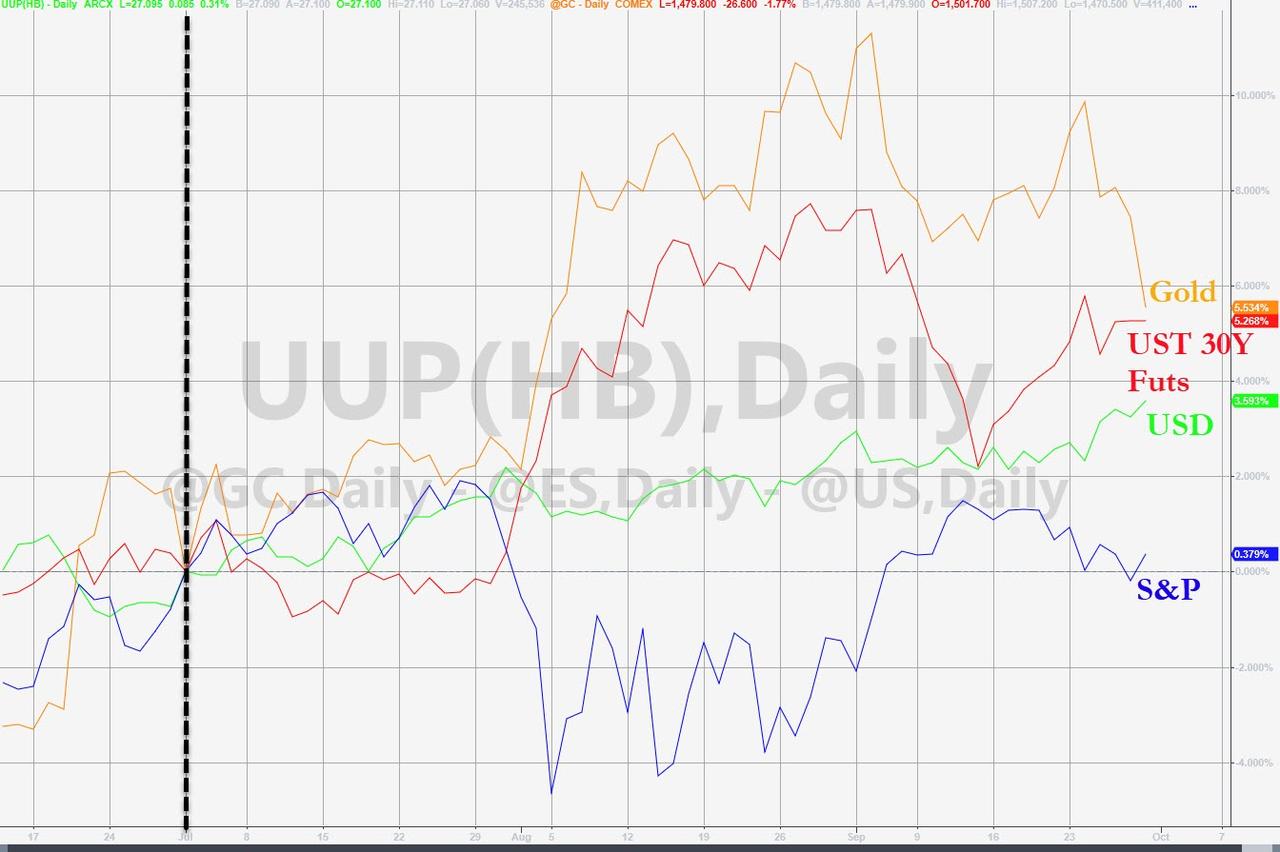
On the quarter, Bullion and Bonds were bid - safe
haven flows along with the dollar - as stocks underperformed, scraping out a
very small gain...
See Chart:
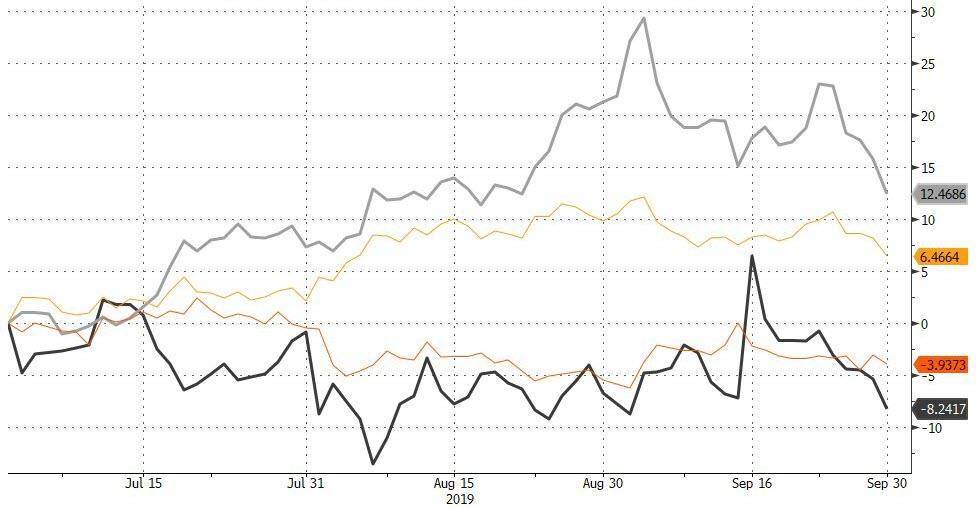
STOCKS
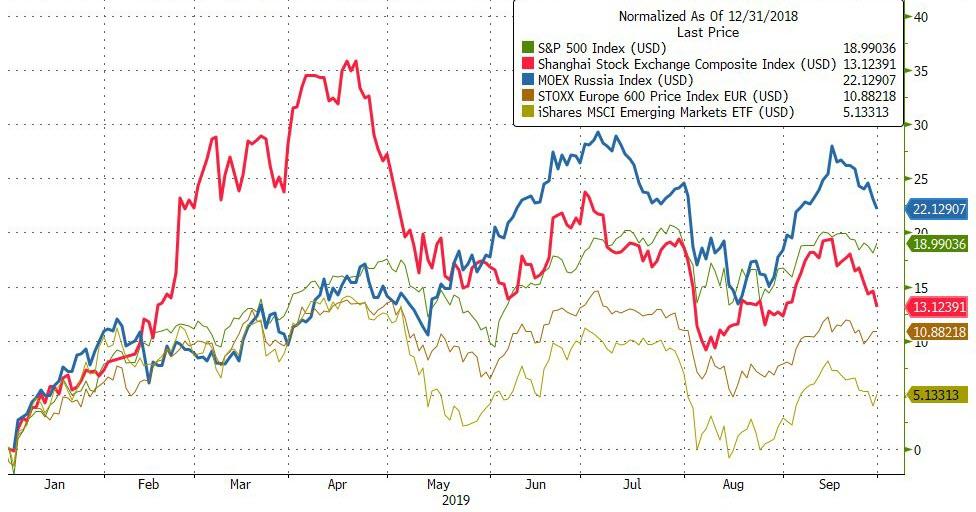
Year-to-date,
Russia is outperforming China and US with EM equities underperforming...
See Chart:
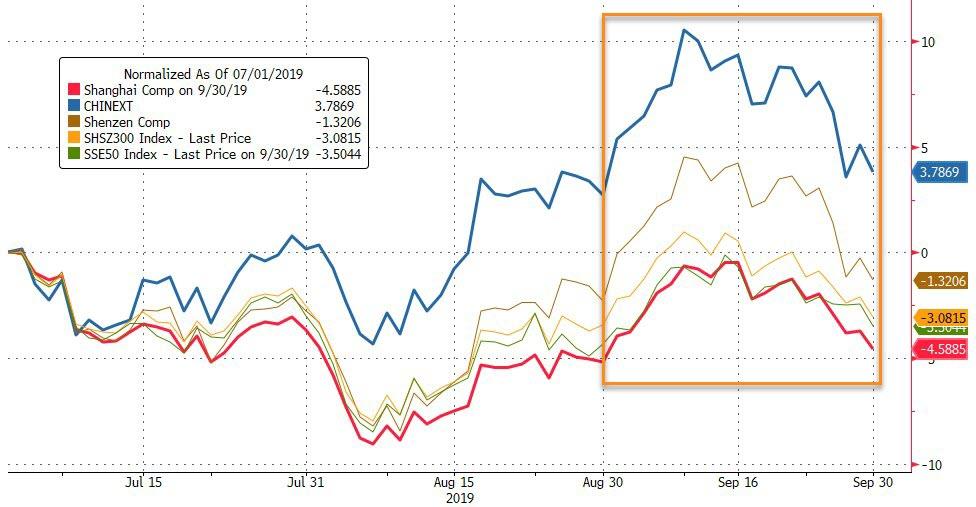
Chinese
stocks scratched out a very modest gain in September, but fell for the second
straight quarter (though the small-cap, tech-heavy ChiNext managed gains in Q3)...
See Chart:
In the US, thanks to a pumpathon today, The Dow and
S&P were up for 3rd straight quarter (while
Small Caps lagged most)...
See Chart:
BONDS
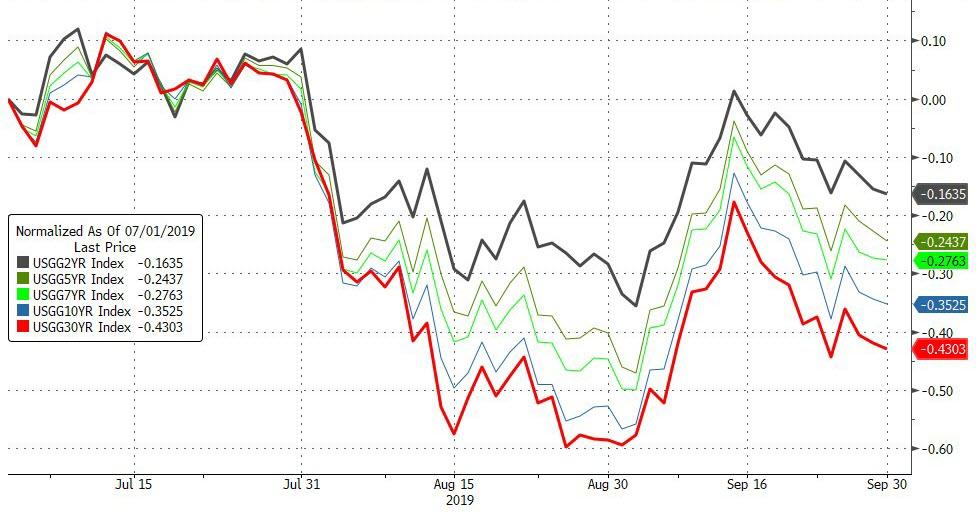
US
Treasury yields crashed in Q3 (for the 4th straight quarter), dropping the most
since Q4 2014...
See Chart:
The yield curve collapsed in Q3 (for the 6th
consecutive quarter)...and remains notably inverted...
See Chart:
UST 3m10Year Spread
30Y
Yields fell today...
See Chart:
UST 30Y
Yield
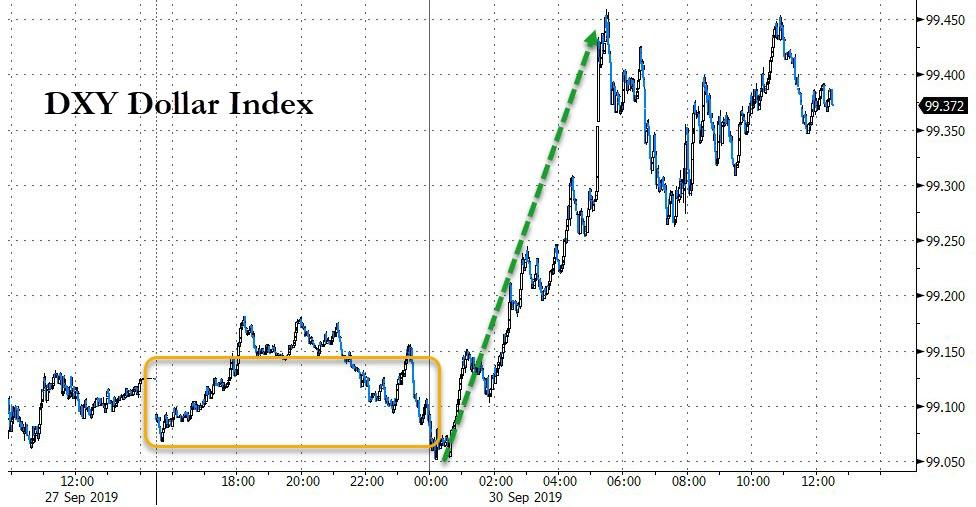
FX
Q3 was
the best quarter for the dollar since Q2 2018...
See Chart:
DXY
Dollar Index
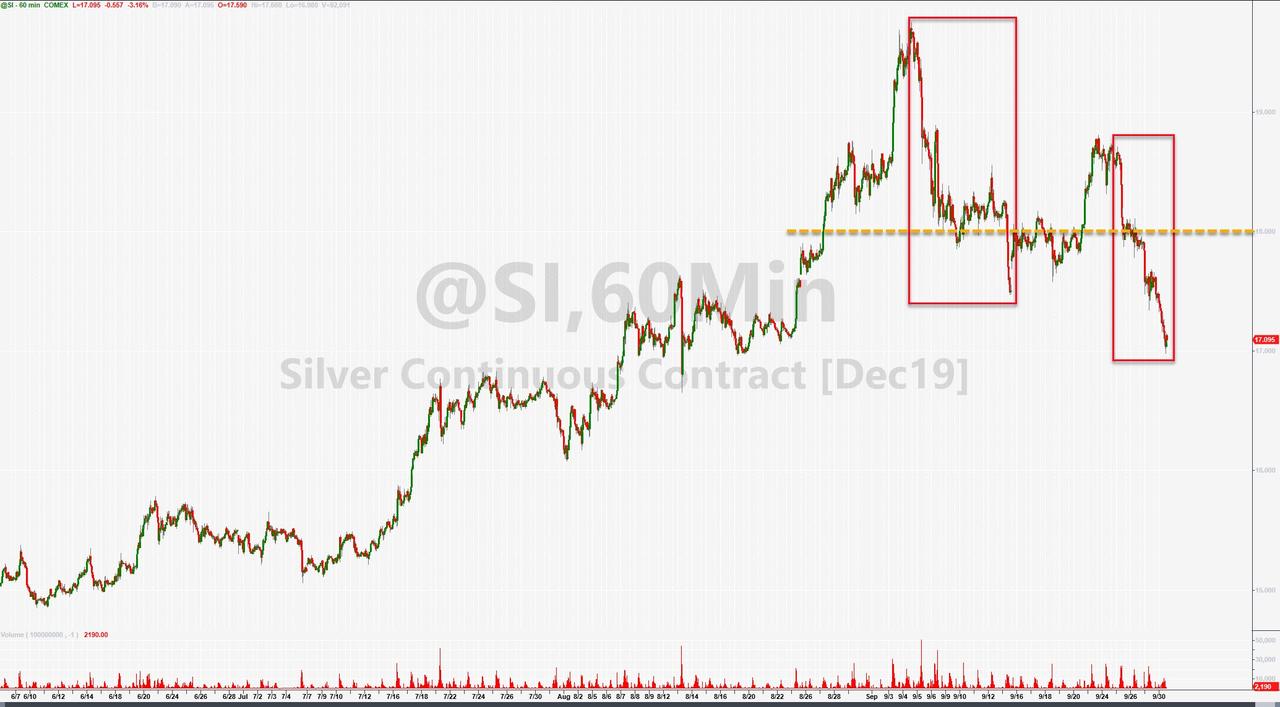
COMMODITIES
Q3 was
a big winner for silver (best quarter since Q1 2017) while WTI fell for the 2nd
quarter in a row...
See Chart:
WTI
plunged again today, dropping back below the pre-Saudi spike levels...
See Chart:
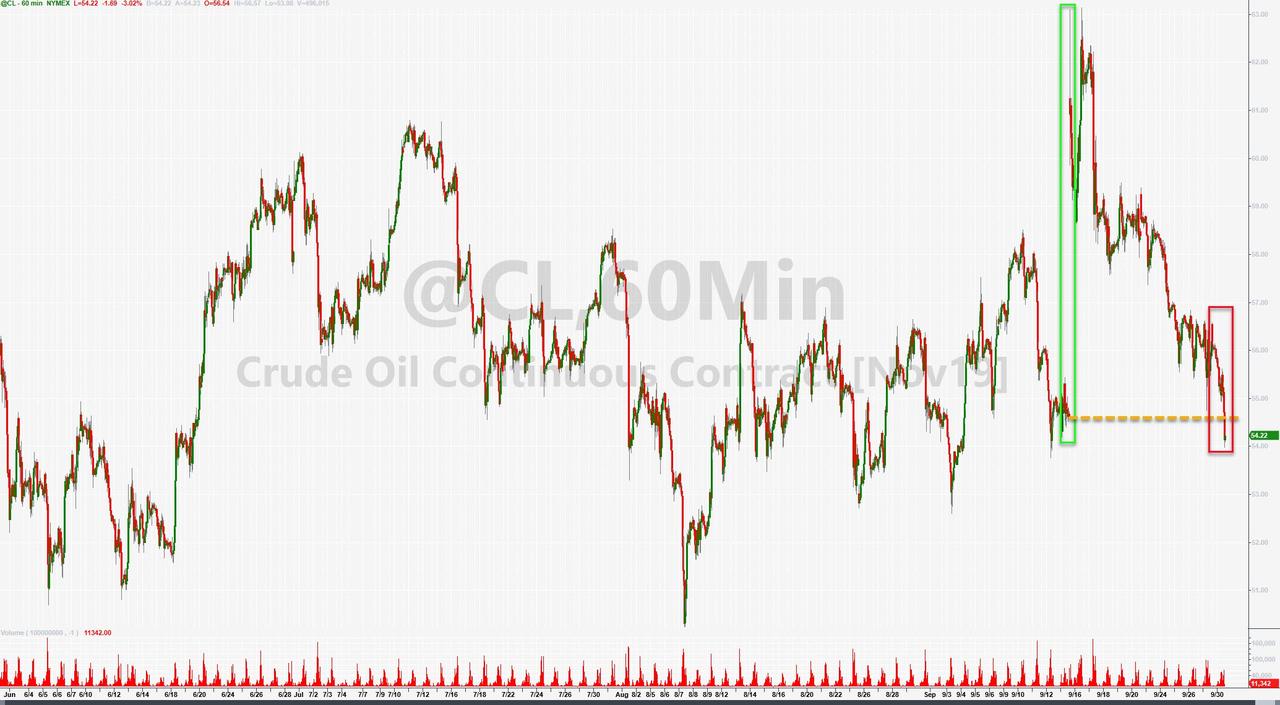
Despite
a great quarter, September saw Silver suffer its biggest monthly loss since Nov
2016 (election)
See Chart:
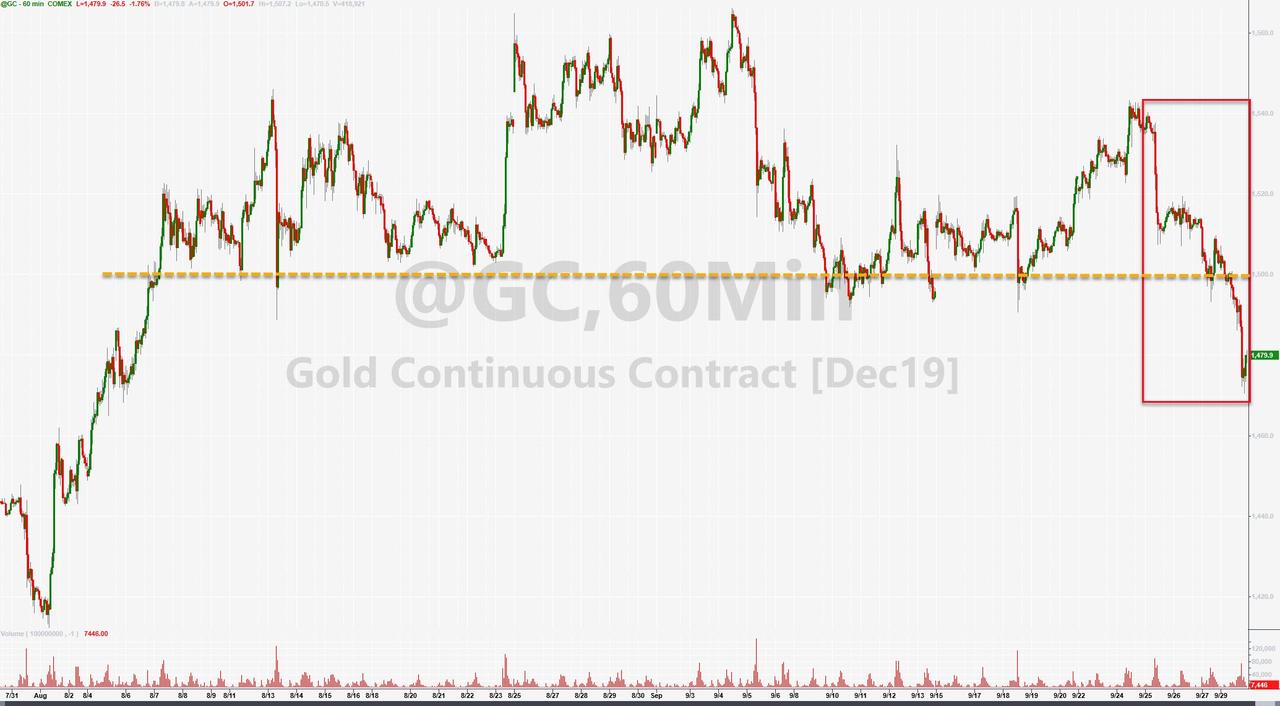
Gold rose for the 4th straight
quarter, ending Q3 at the highest since Q1 2013... But September
was gold's weakest month since June 2018 (after 4 straight months higher) after
losing $1500 following multiple saves...
Time to buy Gold
See Chart:
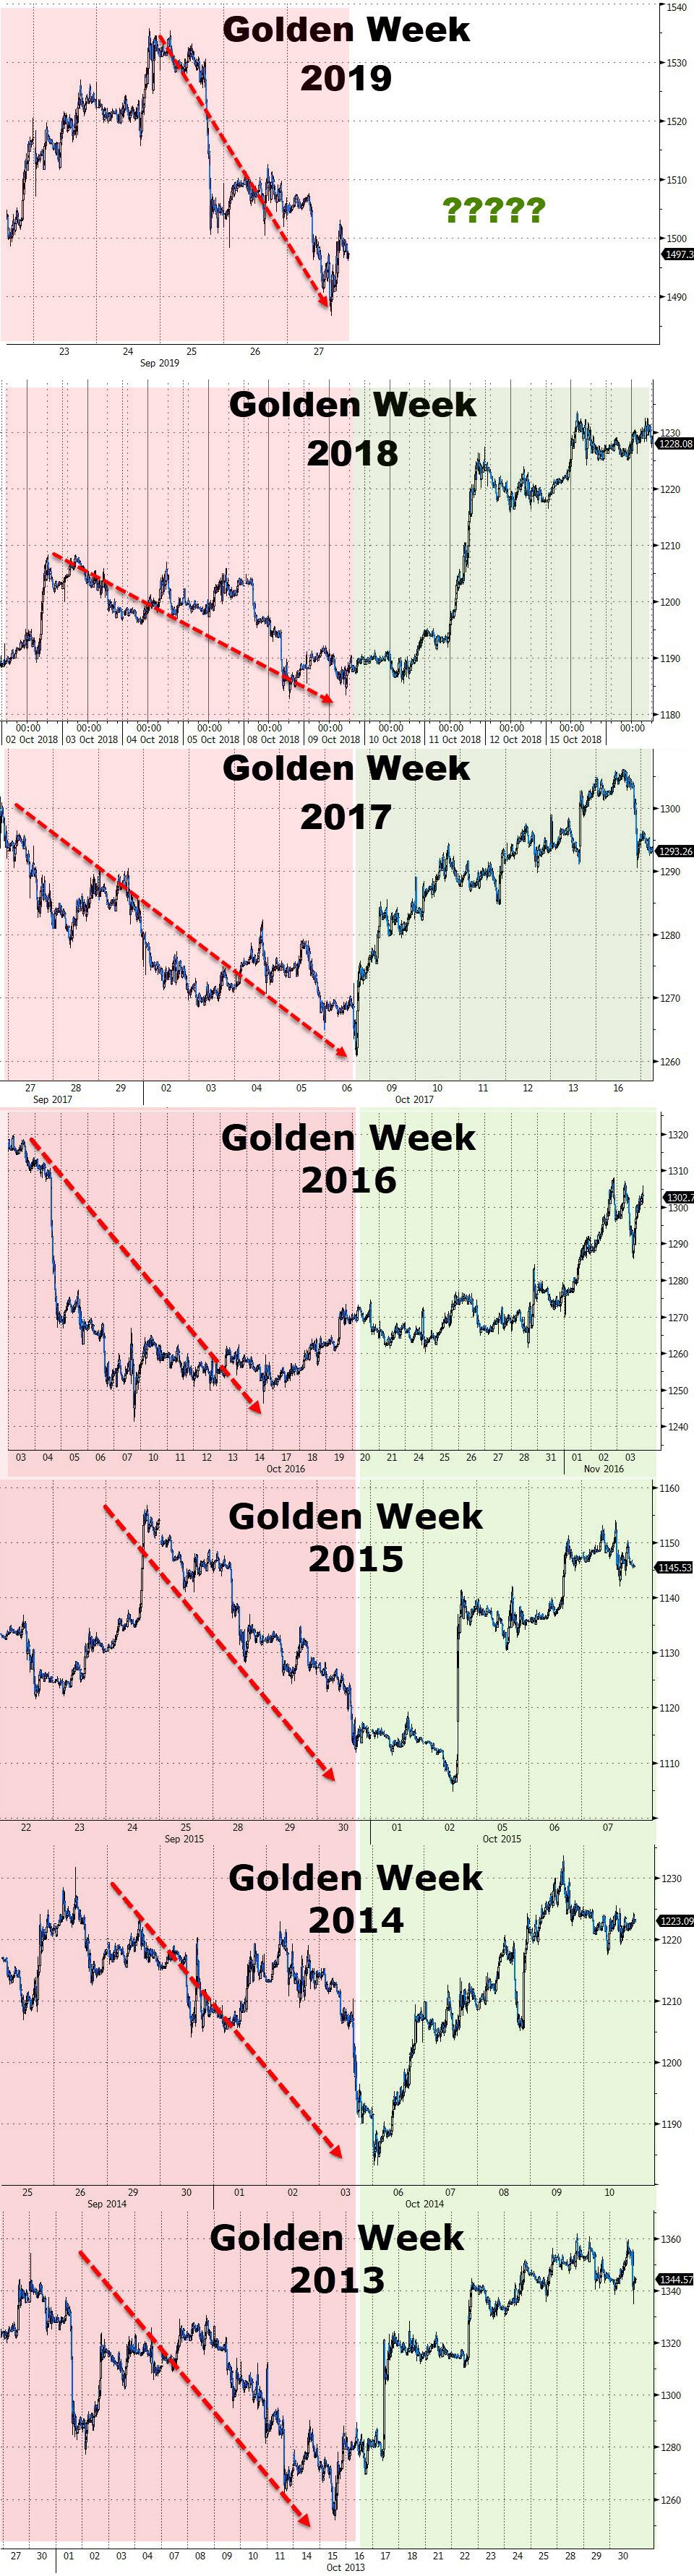
And the
recent weakness should not be a surprise... It happens every Golden
Week...
See Charts:
Don't
forget, stocks are rising on fun-durr-mentals...
See Chart:
And
let's not forget what The Fed is doing everyday...
See Chart:
NY FED
0/N Repo Operations
"Probably
nothing"
Were
you not entertained?.. Probably NOT … too much
sad news y para colmo
de males : los billonarios se robaron los botes del TITANIC.. a flotar, no
queda otra opción La buena noticia es que no hay tiburones en la zona y si los
hay no comen cerdo Amer por orden de hipocr Chinos que son dueños de esos
mares.. razones de salud alegaron.
…
----
----
...it’s unlikely that no trouble will
ensue.
====
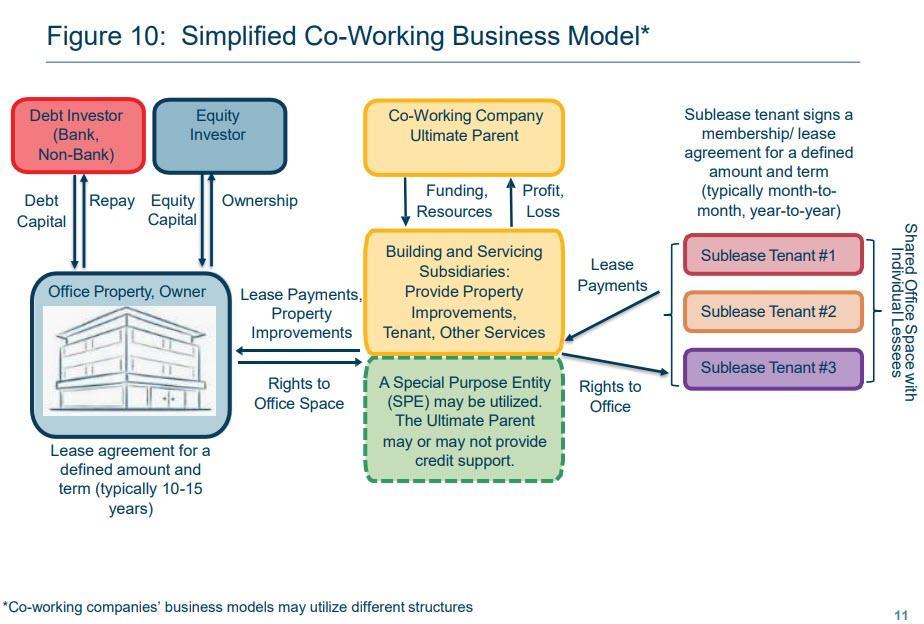
WeWork is flagged as a top five
tenant behind $3.3 billion in CMBS debt across 36 properties, in the US alone.
See Chart:
Simplified Co-working business model
See
more Chart at:
….
SOURCE:
https://www.zerohedge.com/economics/here-are-billions-loans-exposed-potential-wework-bankruptcy
----
----
Stay long pitchforks and water cannons, for now...
SUMMARY
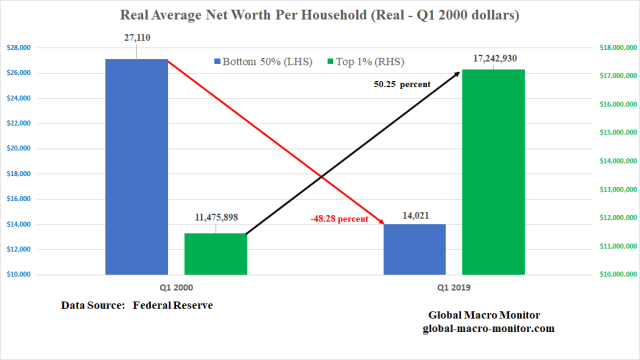
- We illustrate the stark contrast in the growth of household wealth between the different percentile groups since Q1 2000
- The top 1% of households now hold more wealth than the bottom 90%
- The aggregate nominal wealth of the bottom 50% of households has fallen by almost 10 percent since 2000, from 3.4 percent of total household wealth to just 1.3 percent
- The share of the top 1% is now over 31 percent and has grown by over 165 percent since Q1 2000
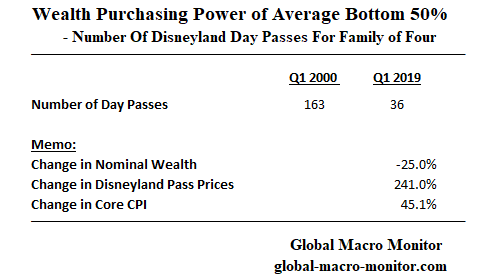
- The average wealth per household of the bottom 50% has declined 25 percent in nominal terms and 50 percent in real purchasing power compared to the 1%’s increase of 118 percent and 50 percent, respectively
- The widening wealth gap is a major factor in the rise of populism in the U.S. and the debate over a wealth tax will be a central focus of the 2020 presidential election
- Asset inflation resulting from quantitative easing (QE) has contributed to the widening wealth gap
- Long pitchforks and water cannons
Who
will win the 2020 Democratic Presidential Nomination?
See Table:
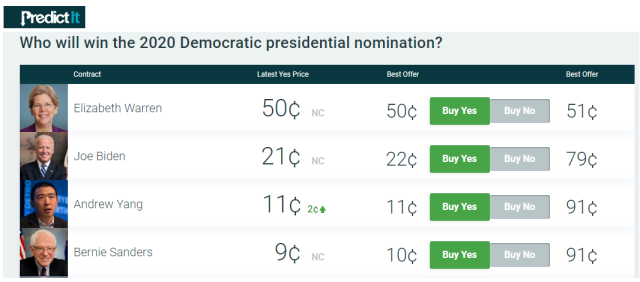
Here is a little snippet of
Elizabeth Warren’s plan for a wealth tax from her campaign website.
..an
Ultra-Millionaire Tax on America’s 75,000 richest families to produce trillions
that can be used to build an economy that works for everyone — elizabethwarren.com
During the next week, we will
present a series of posts analyzing wealth distribution in the United States,
which seems to have reached a political tipping point. The top
1% of American households now have more wealth than the bottom 90% compared to 79 percent of the bottom 90% in Q1 2000.
Just a few caveats before
looking at the following charts.
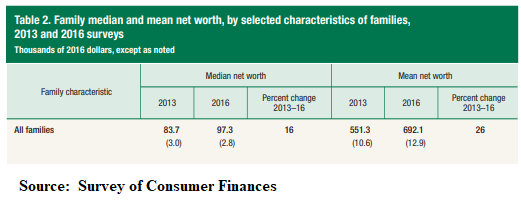
First, see
our post, Be
Skeptics Of Macro Data In The Two-Speed Economy, warning about
looking at averages when data distributions are so skewed. This is illustrated in the bible of wealth distribution, the
Fed’s Survey of Consumer Finances (SCF),
See Chart:
Second,
our estimate of the number of households, which we have sourced from the Census
Bureau and extrapolated for the current year. There is an ongoing debate
about what constitutes a household and a family. Nevertheless, we
are very confident our estimates in the following two charts are very good and
close approximations of the data that will be eventually published in the next
SCF, which should be out in a year or two.
The Raw Data
The following table illustrates
the aggregate wealth data from the Fed’s new Distributional
Financial Accounts (DFA). Note we
use the terms “wealth” and “net worth” interchangeably.
See Table:
Distribution
of Nominal Wealth by Percentile
Key Takeaway
The most stunning takeaway, at
least for us, from the table is that the nominal
aggregate wealth of the bottom 50% has declined, underscore fallen in nominal terms, over the past 19 years.
That is almost a 10 percent decline while, at the same time, the wealth
of the top 1% has increased by 166 percent. The share of the total
household wealth of the bottom 50% has dropped from a mere 3.4 percent in 2000
to 1.3 percent in Q1 2019.
The aggregate wealth of the top
1% relative to the bottom 50% has increased from a factor of 8.5 to 24.6 from
Q1 2000 to Q1 2019. Stunning and politically
dangerous.
The data are even starker when
taking into account that household formation has grown by over 20 percent since
the beginning of 2000.
Real Average Wealth/Net Worth Per Household
See Chart:
Real-World Example Of Wealth Decimation
It is hard to comprehend the
decimation in purchasing power of the wealth of the average household on the
other side of middle from 2000 to 2019 but let us help with a simple real-life
example.
See
Chart:
Wealth purchasing power of
average bottom 50%
Another Data Caveat
One should not make the mistake
of viewing the above comparisons as a panel
study. That is there is no doubt that some households were in the
bottom 50% in 2000 are now in the top 1%, and vice versa.
In addition, the data are
averaged with a range from a deeply negative net worth for the lowest
percentiles of the bottom 50% to around $100k of the top percentile of the
bottom 50%. Ditto for the top 1% where a few of the highest
percentile households hold over $100 billion in wealth and the lowest of the
top 1%, i.e., the
99th percentile of all U.S. households, is just over $10 million.
Keep that in perspective,
folks, during your meditation on the data.
Why The Wealth Divergence?
One, or the major factor of the wealth divergence is
that the returns earned on assets such as stocks, bonds, and equity in private
businesses have greatly exceeded the growth of wages, which have been nothing
short been dismal over the past 20 years. The several rounds of quantitative easing (QE) and the
subsequent asset inflation have greatly contributed to the problem, increasing
the support for some kind of a People’s QE.
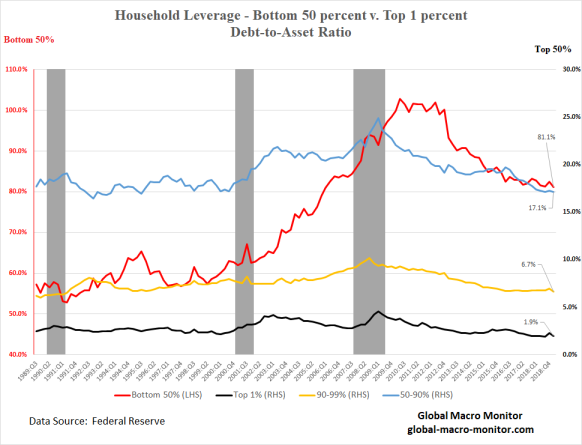
We also illustrated in an earlier
post how debt-laden the bottom 50% is relative
to other percentile groups.
See Chart:
Upshot
So, there you have it, folks.
It doesn’t take a Ph.D. economist or political
scientist to understand what, we believe, is the biggest problem in today’s
political economy. Just contemplate and study the few charts and data
points above.
It will certainly be one of the
main drivers of the 2020 presidential election and the winner will most likely
be the candidate who convinces the majority of the electoral college or voters
in the swing states, that he/she can best fix the problem or, more darker, is
better at exploiting the rage against it. Yikes!
Either way, we suspect the 2020 campaign will be
very ugly.
Can Markets Handle A Hard-Left Turn?
We are not so sure asset markets can handle and
sustain a hard-left political turn. We are fairly certain, however, the
current trajectory of the distribution of household wealth is not politically
sustainable.
Wealth Tax As An Investment In Social Stability
Nevertheless, some sort of redistribution of wealth
from the uber-wealthy is inevitable, in our opinion. After all, the top of the top 1% have taken
down an extraordinarily disproportionate share of the increase in total
household wealth since 2000. They should view some sort of a wealth tax
as an investment in the country’s social infrastructure and political stability
in order to protect the totality of their asset holdings.
….
----
----
US DOMESTIC POLITICS
Seudo democ duopolico in US is
obsolete; it’s full of frauds & corruption. Urge cambio
...at every
turn we see the fingerprints of the CIA and its allies in the US
deep state...
====
US-WORLD ISSUES (Geo Econ, Geo Pol & global Wars)
Global depression is on…China,
RU, Iran search for State socialis+K-, D rest in limbo
Why is the Chinese economy so
dependent on US dollars? And what are the broader implications of this? And how do Hong Kong,
and the Hong Kong protests,
fit into China’s economic and political future?
====
...they dropped.
See Chart:
….
----
----
Reports count nine total airstrikes on Iraq's Popular Mobilization
Forces over the past months
====
"Some fanatical US hawks need to take a
closer look at what the Chinese economy has achieved over the past 70 years,
instead of devising crazy ideas about a US-China decoupling."
====
Envoy sources told Reuters that the "late-August deployment was not a
rotation at all, but a reinforcement."
====
SPUTNIK
and RT SHOWS
GEO-POL n GEO-ECO ..Focus on neoliberal expansion via wars
& danger of WW3
- Peru’s
Appoints Vice President Araoz to Replace President Vizcarra Peru’s Congress, dissolved by President Martin
Vizcarra on Monday, has declared him temporarily unfit for governing and has
appointed Vice President Mercedes Araoz to replace him.
-Is
this a CIA interfer?: Peru's Police and Military Leaders Recognize
Martin Vizcarra as President After Congress Dissolved. Por que tiene que meterse
la policía y el ejército en asuntos políticos?. IF US EMBASSY (CIA) is trying to divide the nation.. the US
Embassy must be closed. Vizcarra
fue usado por la CIA contra VEN y hoy
que hay peligro de Guerra mundial y de demandar la cancelación
de la deuda externa y de nacionalizar el oro como
recurso estratégico, la CIA vuelve a usar a Vizcarrra para asegurar su
dominio en Peru y el Sur. Varios mandos superiores del ejército y la policía han
sido entrenados por agencias del US e ISR. La ineficiencia de Vizcarra
limitaron su gobernabilidad y ese pelele debió adelantar elecciones como el
mismo los sugirió. Pero es un blandengue que prefirió apoyarse en la CIA y en
su fórmula de liquidar congresos como lo hicieron en el US , en el UK y otros países.
No queda otra opción sino apoyar la Vice Pdte Mercedes Araoz para que llame de
inmediato a elecciones nacionales. Una vez convocada y formada la comisión
electoral ella puede renunciar a la VP y ser candidata. Lo importante es
limitar el poder a los Fujis y los apristas. Los jefes de la Policia y el Ejercito que recibieron
entrenamiento de agencias US e ISR coordinadas
por la CIA deben ser depuestos. Hay que armar un FRENTE POPULAR anti-imperio y
apuntar hacia el control del Gbno y del senado. Basta
ya de blandengues y de agentes del imperio en las FFAA. Si el WW3 estalla: A cerrar
la Embajada USA.
----
----
NOTICIAS
IN SPANISH
Lat Am search f alternatives to
neo-fascist regimes & terrorist imperial chaos
REBELION ESTA BLOQUEADO
ALAI ORG:
====
RT EN ESPAÑOL
- Retiran del cargo al jefe de Inteligencia militar de Colombia por las fotos falsas de Venezuela presentadas en la ONU
- Maduro: "Duque muestra fotos falsas sobre Venezuela y a la vez niega su relación y la de Guaidó con los Rastrojos" (VIDEO)
- El inicio del 'impeachment' contra Trump, ¿por qué ahora y no antes?
- Mercedes Aráoz asume la presidencia interina de Perú y anuncia que convocará a la OEA Acaso no sabe esta dama que la OEA es 1 agencia del US
- Los peruanos salen a las calles por la crisis política tras la disolución del Congreso
- Congreso peruano disuelto por Vizcarra debate quitar el cargo al presidente por "incapacidad moral"
- Trump cita la advertencia sobre las consecuencias similares a una "guerra civil" si se lleva a cabo su juicio político
- "Es una verdadera bestia": El huracán Lorenzo se acerca a Europa
- Manifestantes de Hong Kong se arman de más banderas extranjeras
----
----
GLOBAL
RESEARCH
Geopolitics & Econ-Pol
crisis that leads to more business-wars from US-NATO allies
----
----
DEMOCRACY
NOW
Amy Goodman’ team
----
----
Catalan
separatists mark anniv. of independence referendum
----
----
===
No hay comentarios:
Publicar un comentario