ND
NOV 7 19 SIT EC y POL
ND denounce Global-neoliberal debacle y propone State-Social
+ Capit-compet in Eco
ZERO HEDGE ECONOMICS
Neoliberal globalization is over. Financiers know it, they
documented with graphics
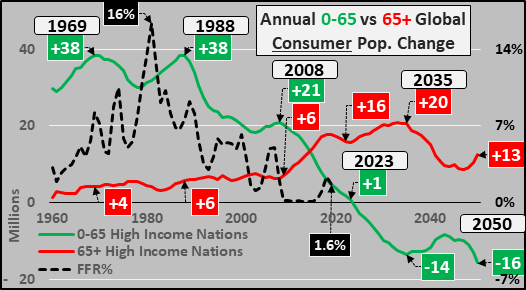
The demographic situation the world faces is unprecedented and unparalleled in modern history...
See Chart:
….
SOURCE:
----
----
...people in government
generally do not want the public to know when the system is in decline
because this looks bad for them. They prefer
to rig statistical indicators as much as possible and hope that no one
notices...
There are many problems when attempting to track a faltering
economy. For one, the people in government generally do not want the public to know when
the system is in decline because this looks bad for them.
They
prefer to rig statistical indicators as much as possible and hope that no one
notices.
When the crash occurs, they then claim that “no one saw it coming” and
the disaster “came out of nowhere”, so how could they be to blame?
I have even heard it
argued that political leaders, including the president,
have a “duty” to lie about the state of the economy because once they admit to
the decline they will cause a panic and perpetuate the crisis. This is
stupidity. If an economic system
is in disrepair and is built on a faulty foundation, then the problems should
be identified and fixed immediately.
Another
factor, which some people might call “conspiracy theory” – but it has been
proven time and time again in history – is that the money elites have a
tendency to engineer economic disasters while deliberately hiding the real
statistics from the public. Why? Well, if
the real data was widely disseminated, then a crash would not be much of a
surprise and the populace could be prepared for it.
The most
rigged statistics tend to be the least important overall in analysis, but this
does not stop the mainstream media and investors from hyper focusing on them. How many times have you told friends
and family about the collapse in manufacturing or the explosion in consumer and
corporate debt, only to hear them say, “But the stock market is at all-time
highs!”
While the issue of rigged statistics makes analysis
of a crash difficult, a willfully ignorant citizenry makes reporting on the
real data almost impossible.
Here are the
indicators so far that prove a crash is happening in the U.S. while a majority
of the public is oblivious:
GDP numbers are completely manipulated. Government
spending of taxpayer dollars on a number of inflated programs, including
continued spending on Obamacare, is added to GDP calculations.
Without this fancy accounting, U.S.
GDP growth would actually be negative,
according to ShadowStats. But even with the juiced data, official GDP
growth is still in decline, falling
to 1.9% and well below the 3% growth we were supposed to see this
year.
Official unemployment stats remain at all-time lows, which is
commonly cited by the mainstream media, Donald Trump (he used to argue the
opposite three years ago), and even the Federal Reserve in reference to the
health and stability of the economy. What they do not mention much is the 95 million people not in the labor
force and not counted because they have been unemployed for so long. When the media does mention this fact, they claim
the number is “misleading”, that most of these people are students or retired,
that the retirement age is decreasing and Baby Boomers are leaving the
workforce sooner, and that the people who don’t have jobs are simply “not
interested” in working. None of this is true.
The retirement age is increasing in the U.S., not decreasing, according the SS
Administration. Current average
retirement age is now 67, up from 65, almost the same as it was during the
Great Depression.
Baby Boomers are not retiring at
rates similar to ten years ago, and are in fact attempting to stay
in the workforce due to the poor economy. Many of them are trying to
come OUT of retirement just to make ends meet.
The labor participation rate remains near record lows.
Interestingly, the Bureau of Labor
Statistics (BLS) house survey that is used to determine if people “want a job”
assumes that if you are near retirement age and do not have a job, you are
simply not interested in a job, and they count you as “non-participating”.
However, if you DO have a job and you are near retirement age, they count you
as participating. It’s a rather convenient assumption on the government’s part
to claim that just because an unemployed person is near retirement age, that
means they “don’t want a job”.
While there is surely a small
percentage of the 95 million people not counted in the labor force that do not
want a job, if unemployment stats counted U-6 measurements as they used to, the
unemployment rate would be closer to
20%.
Another problem is the quality of jobs being created. U.S. manufacturing jobs, as well as
higher wage jobs, are in steep
decline. They have been replaced with low paying jobs in the service
sector.
Real wages in the U.S. have not kept up with inflation. The average worker is now losing
money overall as prices rise beyond the pace of their incomes.
As more and
more Millennials say they cannot afford to buy a home, rental prices have skyrocketed in
the past several years.
The home ownership rate plunged starting
in 2006 and has not recovered since.
U.S. manufacturing has fallen to
levels not seen since the crash of 2008.
U.S. factory orders have slumped in
2019.
U.S. Services PMI continues to falter since spring of this year. Job growth is now slowing and over
8,500 retail stores have been closed down already
in 2019. Web-based retail is not picking up the slack, as online sellers like
Amazon are suffering from falling profits.
Corporate profits overall have tumbled this year and projected future
profits have been drastically
adjusted to the downside.
Corporate debt, consumer debt and national debt are all at historic highs. Corporate cash flow is so tight that
Federal Reserve repo
purchases continue to run into high demand. This debt signal is one we
saw in 2007, just before the credit crisis.
U.S. trucking and railroad freight continue to log steep declines in traffic and goods. This tells us what we
already know: Even though consumer spending has increased recently, this does
not mean people are buying more stuff or have more disposable income. What is
really happening is inflation, or stagflation. Cost of living is going up. Debt
payments are going up. Consumers are spending more on the same amount of stuff,
or less stuff, and have less expendable income. U.S. consumers are being bled
dry.
All of
these factors and more show an economy in recession or depression (depending on what historic standards you use). In
the darker corners of the investment world, the great hope is that the central
banks will return to pumping trillions into the banking sector ($16 trillion
during the TARP bailout dwarfs the $250 billion the Fed has recently pumped out
in their repo markets). They hope that this will free up even more credit.
Meaning, they believe only more debt will save the system from suffering.
I say, time is up on the debt party. More stimulus will not stall
the crash that is already happening, and the Fed does not appear poised to
print anywhere near what it did during the credit crisis, at least not in time
to change the trend. The can has been kicked for the last time. The grasshopper
mentality will not save people from the clear reality. Only preparation and
planning will.
….
----
----
The markets... have now extended the
recent panic-buying to "extreme greed" territory...
See Chart: [[ The official STORY
first. The truth comes at the end
]]
FEAR and Greed Index
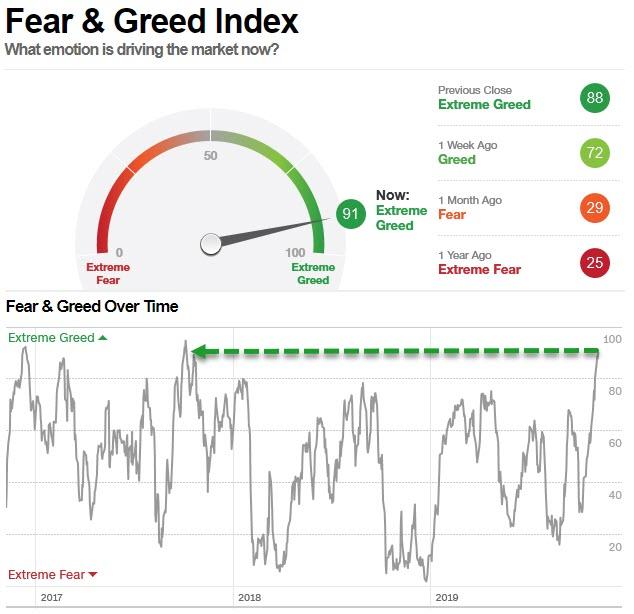
US (cash) markets gapped open and
then drifted all day with Small Caps barely holding on to gains...
See Chart:
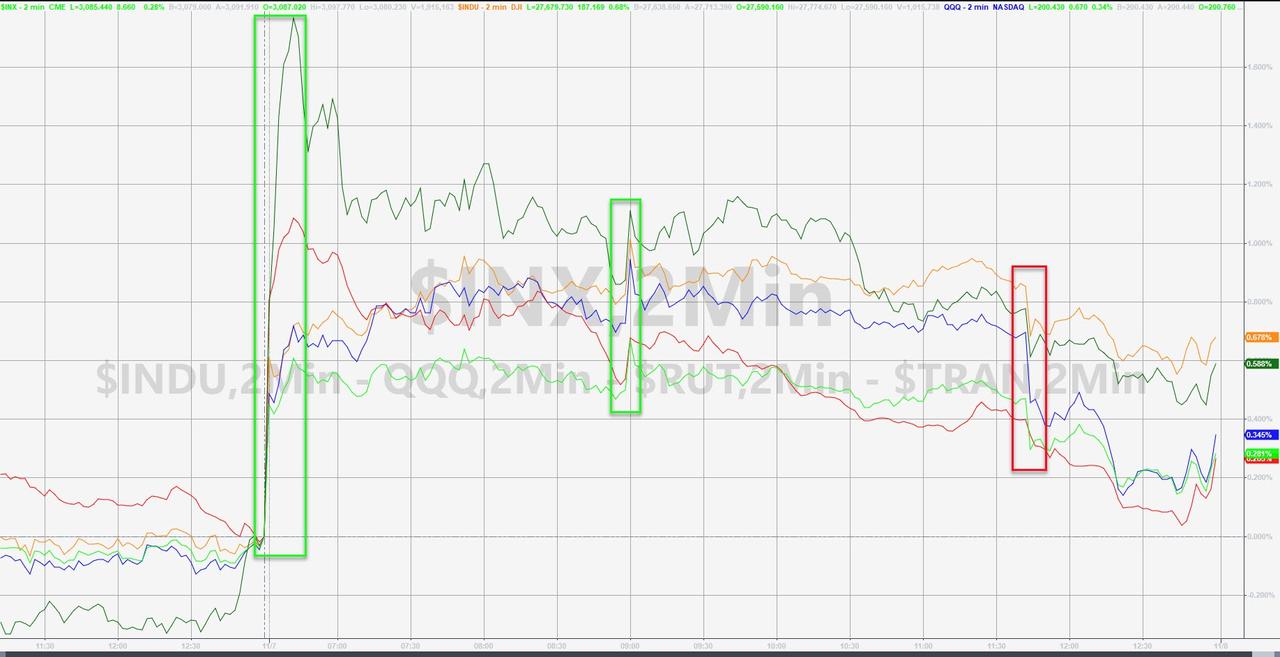
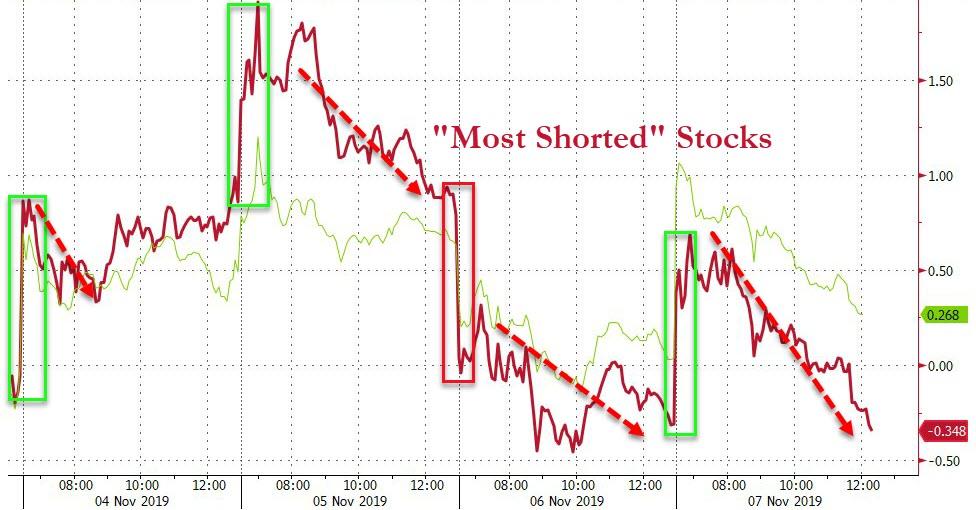
All thanks to an initial
short-squeeze, which, however, gave it all back by the close as it appears the
ammo for these pushes is running dry...
See Chart:
“Most Shorter” Stocks
DAWN
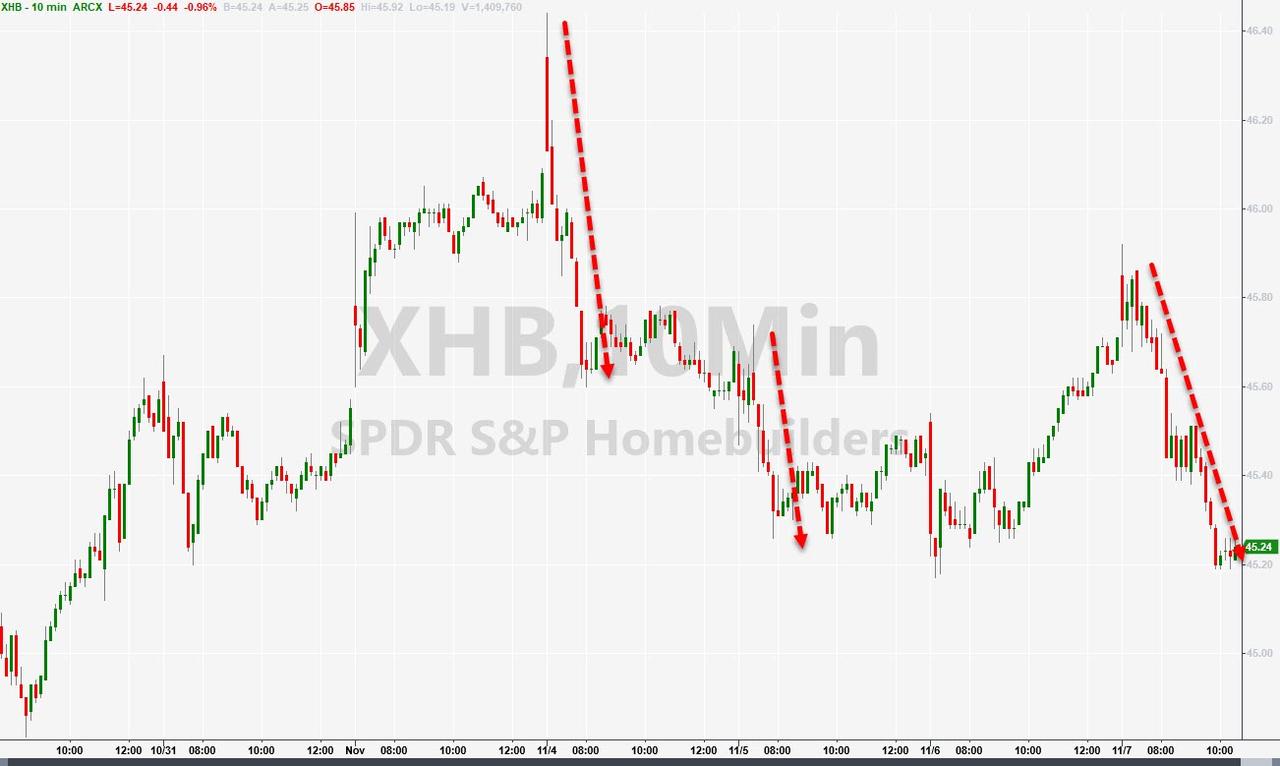
US Homebuilder stocks tumbled as
rates soared...
See Chart:
That is a $450 billion addition to
market cap for APL...
See Chart:
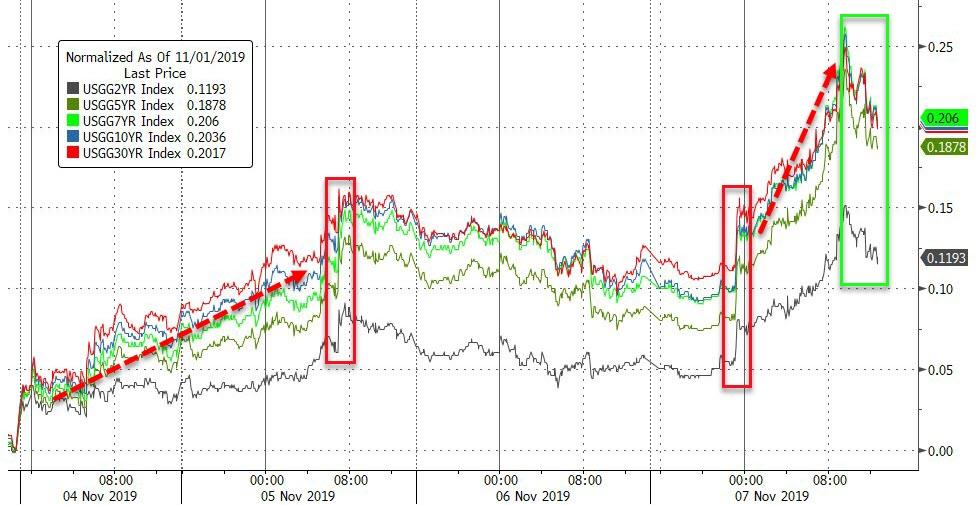
It was a bloodbath in bonds today as
Treasury yields exploded higher...
See Chart:
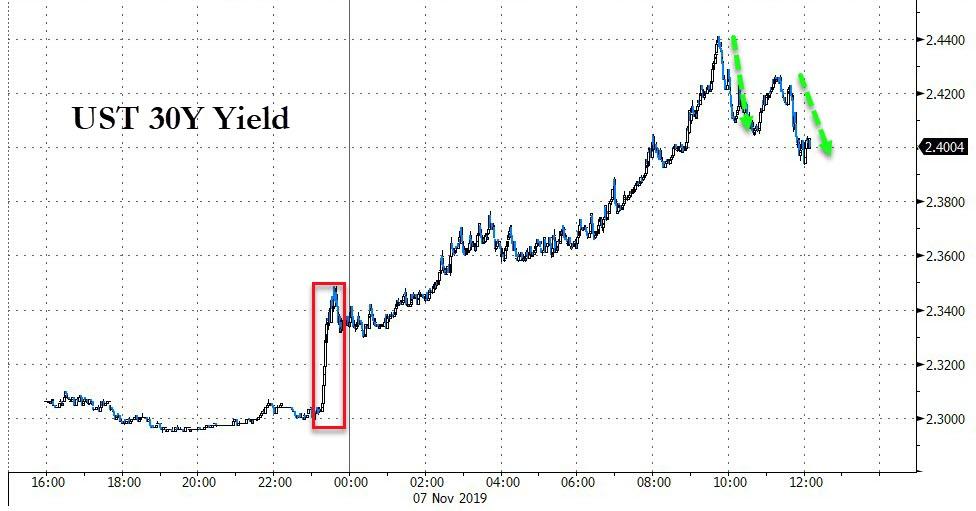
UST
30 y Yield DOWN
See Chart:
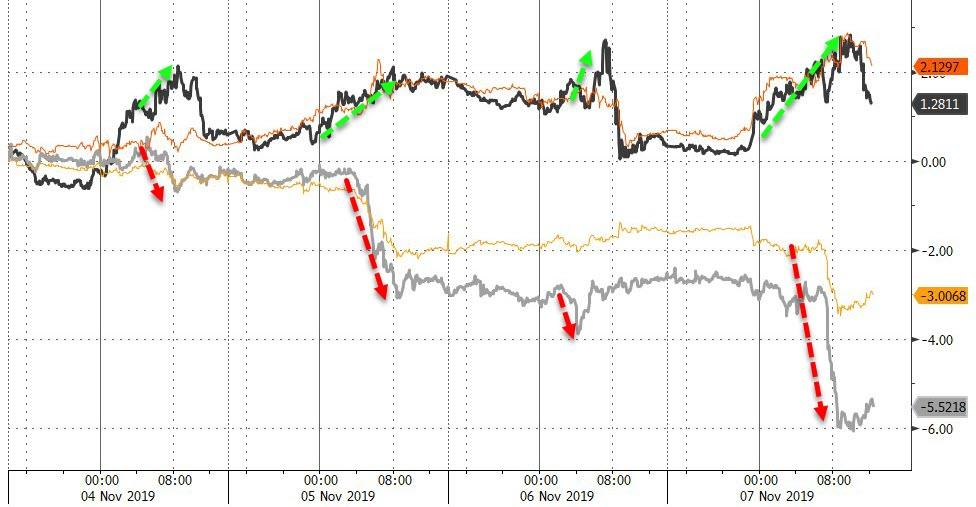
But bear in mind that the
un-inversion of the yield curve is the typical pattern ahead of a recession...
See Chart:
Notably the dollar rally stalled at
the highs from FOMC day...
See Chart:
Trade deal optimism sparked the
ubiquitous dump PMs, pump crude/copper trade...
See Chart:
Gold was monkeyhammered to 3-month
lows... before rebounding
See Chart:
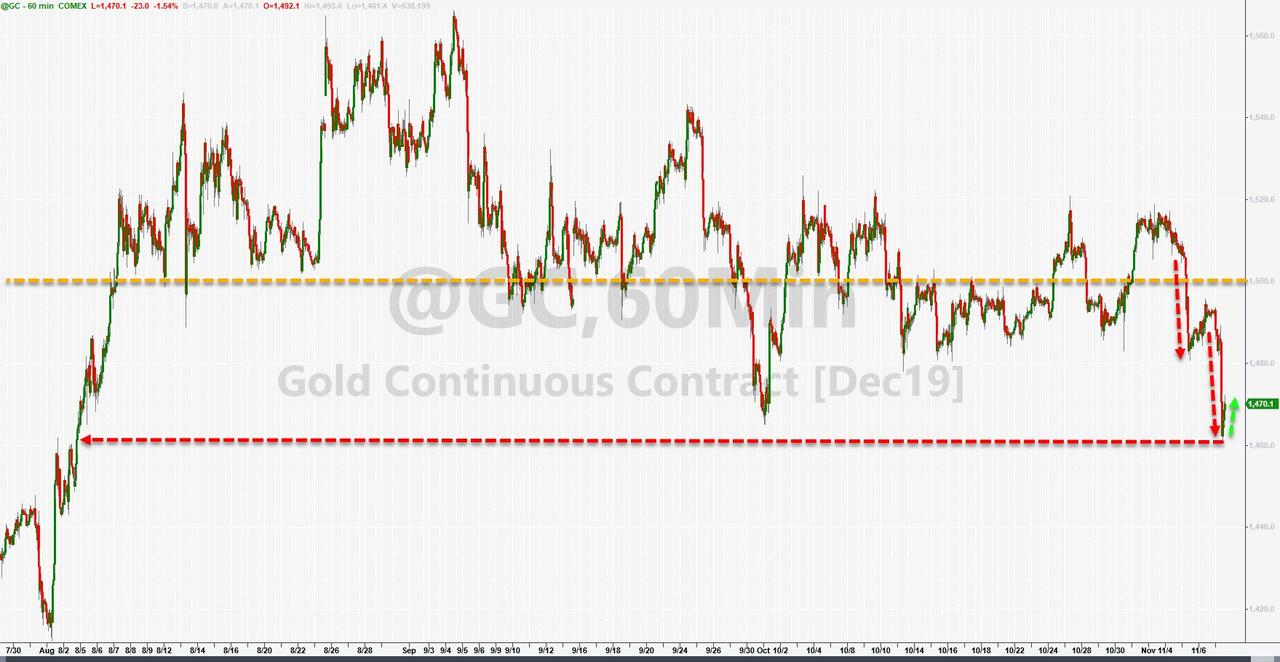
Finally, will gold catch down to
global negative yielding debt volumes or are rates set to tumble once again?
See Chart:
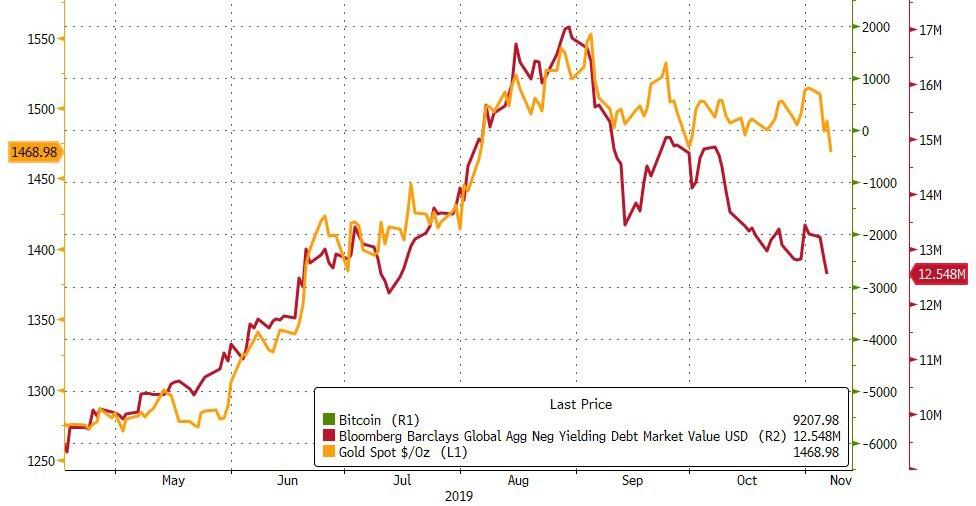
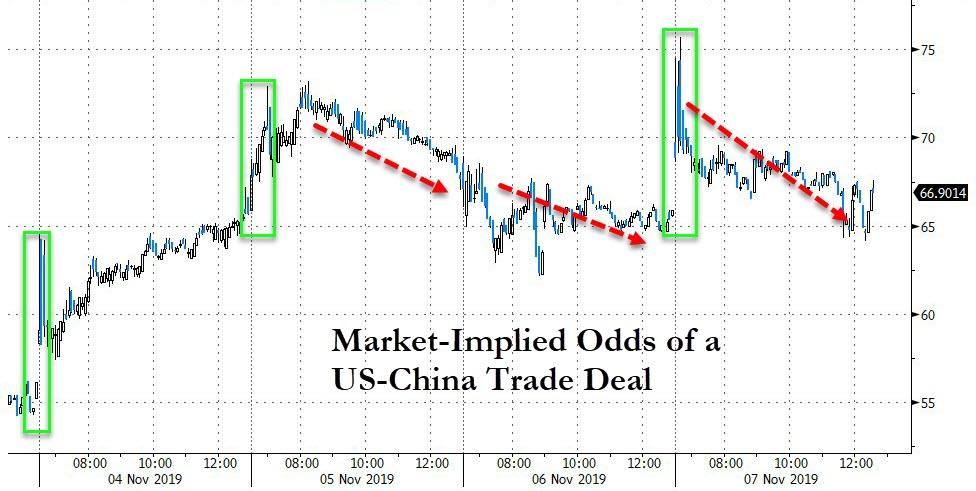
And if the trade deal is so close...
why does the market keep backing away from the surges in the odds of a deal?
See Chart:
Market implied odds of US-China Trade Deal
And just a
gentle reminder, the last two times that yields rose this aggressively did not
end well for stocks. As Bloomberg details, the
five-week change in the 10-year yield is now 40 bps...
See Chart:
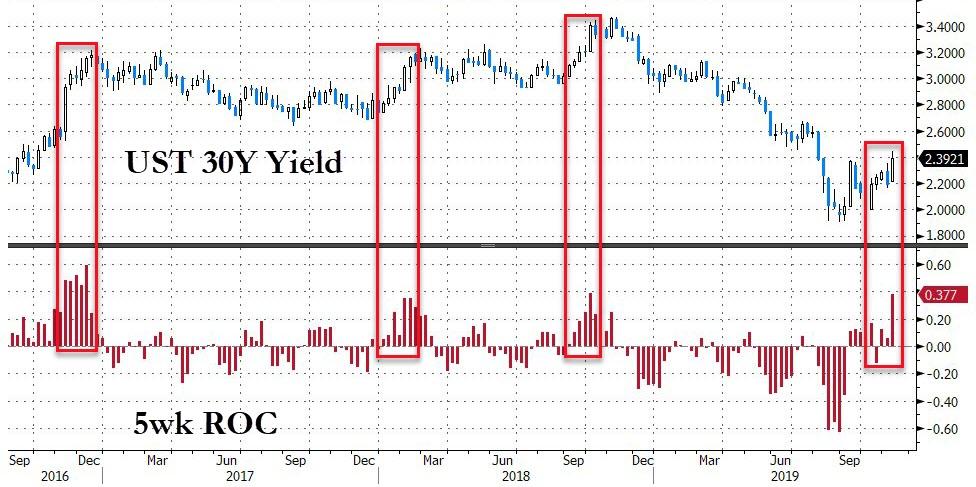
...and the last two times we reached
that threshold were Oct. 8 and Feb. 2 of last year -- both bad days for stocks.
See Chart:
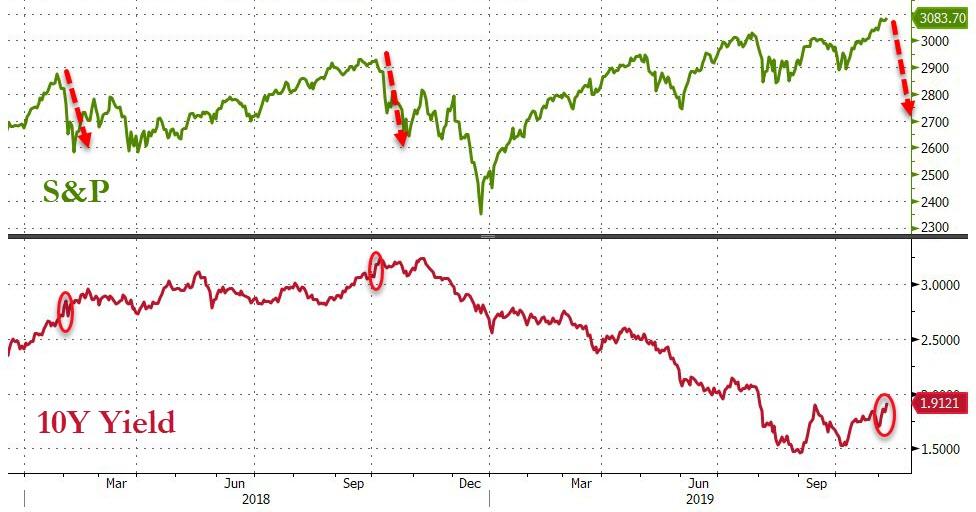
….
SOURCE: https://www.zerohedge.com/markets/more-trade-talk-sparks-bond-bloodbath-precious-metals-pounded
----
----
US
DOMESTIC POLITICS
Seudo democ duopolico in US is obsolete; it’s full of frauds
& corruption. Urge cambio
"Kent,
the deputy assistant secretary of State for European and Eurasian Affairs,
oversees administrative policy in a bloc of Eastern European countries, including Ukraine."
====
Are investors
more likely to lose money betting on an aging company that owes the banks money
or in today’s bell-ringing darlings of Wall Street? We decided to run the numbers and see...
====
Stock markets are making new highs, but... there are a lot of cracks under the surface...
====
With the U.S. presidential cycle gearing up, Elizabeth Vos takes stock
of lessons from 2016...
====
US-WORLD ISSUES (Geo Econ, Geo Pol & global Wars)
Global depression is on…China, RU, Iran search for State
socialis+K-, D rest in limbo
US intervention could be worse than drug cartels.. for them
& for US
"...
there is one — and only one —
way to get rid of drug cartels, drug gangs, and drug lords. That way is through
drug legalization..."
====
SPUTNIK and RT SHOWS
GEO-POL n GEO-ECO
..Focus on neoliberal expansion via wars & danger of WW3
----
----
NOTICIAS IN SPANISH
Lat Am search f alternatives to neo-fascist regimes &
terrorist imperial chaos
REBELION:
ALC:
Raúl Zibechi “Las culturas de abajo son el cimiento del
nuevo mundo”
====
ALAI ORG
----
----
RT
EN ESPANIOL
El modelo nuevo hoy usado no es funcional para mi reporte
COUNTER PUNCH
Analysis on US Politics & Geopolitics
Thomas Knapp Mexico:
One Failed US War Doesn’t Justify Another
----
----
GLOBAL RESEARCH
Geopolitics & Econ-Pol crisis that leads to more
business-wars from US-NATO allies
----
----
DEMOCRACY NOW
Amy Goodman’ team
-Algerian
Protesters Are Still in the Streets, Months After Pushing Out Longtime President
Bouteflika
----
===
No hay comentarios:
Publicar un comentario