ND
NOV 17 19 SIT EC y POL
ND denounce Global-neoliberal debacle y propone State-Social
+ Capit-compet in Eco
ZERO HEDGE ECONOMICS
Neoliberal globalization is over. Financiers know it, they
documented with graphics
Now the US Empire depend on China: see last statements
"We’re
closing the underweight we’ve held on global equities since early July. At that
time, we thought weaker growth would pressure valuations. Instead, despite a
continued slowdown, the MSCI ACWI Global Equity Index has gained about
3%."
Just over 4 months ago, on July 8, Morgan Stanley took
a defiant position against the bullish consensus, and in a note penned by the
bank's chief cross-asset strategist, Andrew Sheets, he said that "we’re
putting our money where our mouth is" and downgraded "both equities
and credit" to underweight while going equal-weight government bonds and
overweight cash.
Specifically, the bank said that in light of concerns that "bad data should
be feared rather than cheered because it will bring more central bank
easing" (it most certainly did, and just three months later
the Fed launched QE4), and that "the market is too optimistic on 2019 earnings and is underestimating the
pressure from inventories, labour costs and trade uncertainty" In
light of these concerns and others, we are downgrading our allocation to global
equities from equal-weight to underweight."
The most
straightforward reason for this shift is simple – we project poor returns: Over the next 12 months, there is now just 1%
average upside to Morgan Stanley’s price targets for the S&P 500,
MSCI Europe, MSCI EM and Topix Japan (including dividends and equally
weighted). If we ignore those targets and estimate returns for those same
regions based on current valuations, adjusting for whether returns tend to be
better or worse given current economic data, the upside is very similar (3%).
Morgan Stanley also underscored its
bearish case by pointing out that its Business Conditions Index had just
tumbled to the lowest level on record.
See Chart:
Below is
the full note from Andrew Sheets, titled "Sequencing the Cycle" in which he explains why he and his peers capitulated to their former
global bearish bias, although it remains unclear if their US-focused equity
strategy colleague, Michael Wilson, will be explaining to gloating CNBC hosts
why he was wrong sticking bearish on the S&P500 for most of 2019, as at
least for now, the bank is certainly not optimistic on US stocks.
2019 saw global growth weaken substantially, but very strong
markets. 2020, we think, will see better growth but muted headline
returns. After almost 18
months of decelerating global economic activity, Morgan Stanley’s global
economics team expects growth to bottom in 1Q20 and improve thereafter.
Recent easing by central banks is supporting this recovery, but importantly, we
don’t expect any further action by the Fed, ECB or BoJ beyond programmes
already in place. In 2020, we’re
on our own.
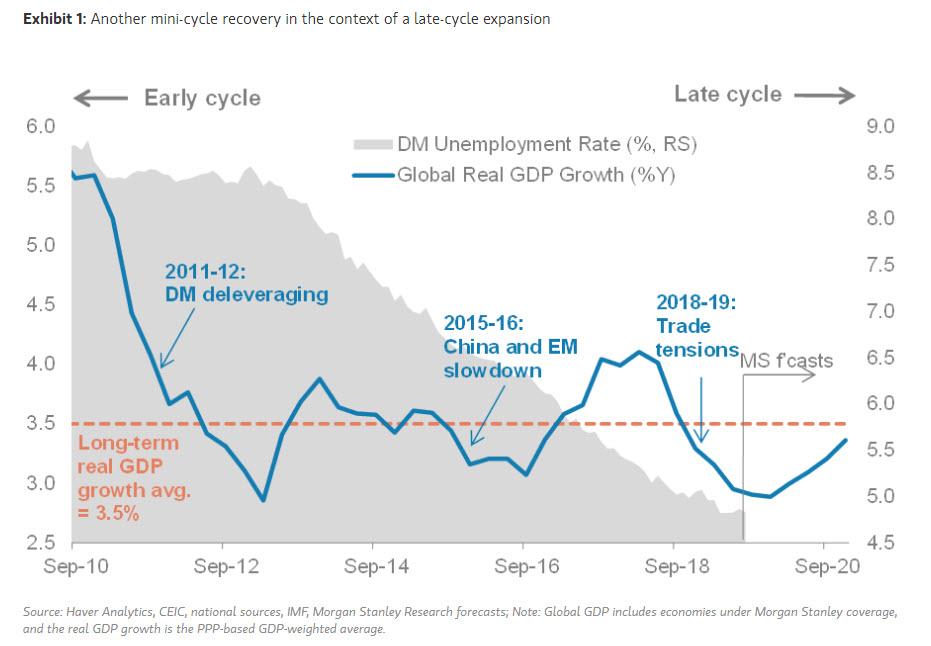
The improvement will be modest
compared with past recoveries, and
will be a mini-cycle recovery in the context of a late-cycle expansion, but it
means that a recession next year would be avoided. Importantly, this
recovery will also be uneven, with the greatest acceleration in corners of
emerging markets against flat-lining growth in the US.
See Chart:
What are we
watching? An unusual aspect of our 2020 story is its
sensitivity to a single factor – TRADE. Our economic forecasts assume no
further escalation in US-China tariffs. This is obviously an
uncertain, evolving situation, and events could change in the hours between
when I finish this note and it hits your inbox. An
escalation in trade tensions would push out the 1Q20 growth recovery that our
economists forecast and re-introduce the risk of non-linearity kicking in.
Markets could face immediate pressure, given how high we believe expectations
have risen that progress is imminent.
….
SOURCE:
----
----
This is just how we manage risk:
"You have a choice to either manage risk, or
ignore it... The only problem is that ignoring
risk has a long history of not working out very well..."
THE “QE, NOT QE”
RALLY IS ON
Last week, we discussed the “QE, Not
QE” rally:
“Just recently, we released a study for our RIAPro
Subscribers (30-Day Free Trial) on historical QE programs and
what sectors, markets, and commodities perform best. (If you
subscribe for a 30-day Free Trial you can read the entire report ‘An Investor’s
Guide To QE-4.’)”
‘On October 9, 2019, the Federal Reserve announced a resumption of
quantitative easing (QE). Fed Chairman Jerome Powell went to great lengths to make sure he
characterized the new operation as something different than QE. Like QE 1, 2, and 3, this new
action involves a series of large asset purchases of Treasury securities
conducted by the Fed. The action is designed to pump liquidity and reserves
into the banking system.
Regardless of the nomenclature, what matters to
investors is whether this new action will have an effect on asset prices
similar to prior rounds of QE. For the remainder
of this article, we refer to the latest action as QE 4.’“
As you
will notice, all major markets increased in value during QE-1, 2, and 3.
Regardless, whether you believe the Fed’s actions are “QE,”
“QE-Lite,” of “Not QE at all” is largely irrelevant.
What is relevant is that each time the Fed has engaged
in monetary programs, the markets have risen. Therefore,
it should not be surprising investors now have a “PAVLOVIAN” response to the Fed’s “ringing of the bell.”
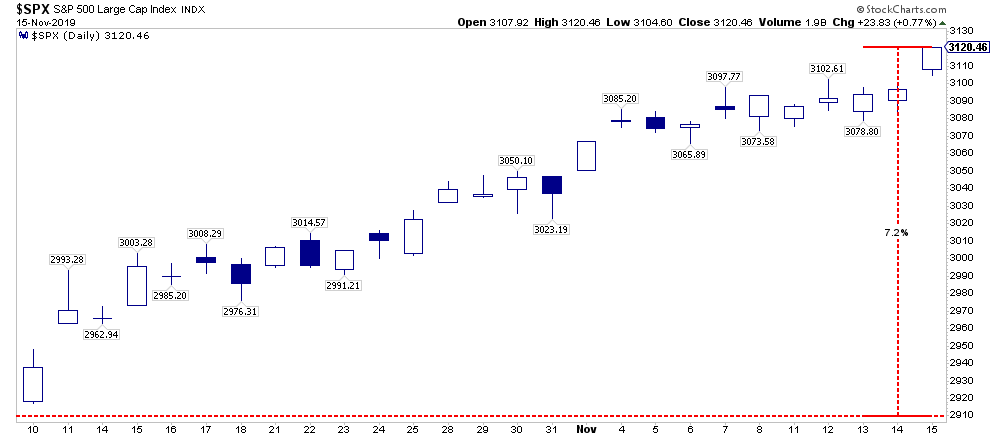
With the Fed cutting rates, Trump
touting “trade deals,” and
now “tax cuts for the middle
class,” not to mention the Federal Reserve increasing their balance
sheet, it should not surprising markets have rallied over the last 5-weeks as
shown below.
See Chart:
This should suggest two things.
- The market has already priced in a bulk of the benefit from the additional liquidity; and,
- The market has advanced too quickly.
TOO FAST,
TOO FURIOUS
On Tuesday, I
posted a series of charts which showed the rather rapid reversion from
more extreme bearishness mid-summer to more extreme bullishness now.
As I noted:
“But it isn’t just the more extreme advance of the market over the past
5-weeks which has us a bit concerned in the short-term, but a series of other indications
which typically suggest short- to intermediate-terms corrections in the market.
Historically, when all of the indicators are
suggesting the market has likely encompassed the majority of its price advance,
a correction to reverse those conditions is often not far away. Regardless of
the timing of that correction, it is unlikely there is much upside remaining in
the current advance, and taking on additional equity exposure at these levels
will likely yield a poor result.”
What is quite amazing is that this
reversal from “bearish” to “bullish” occurred precisely as
the Fed began pumping liquidity into the markets. The last time investor
sentiment was this bullish was at the beginning of 2018, which eventually led
to a near 20% correction.
See Chart:
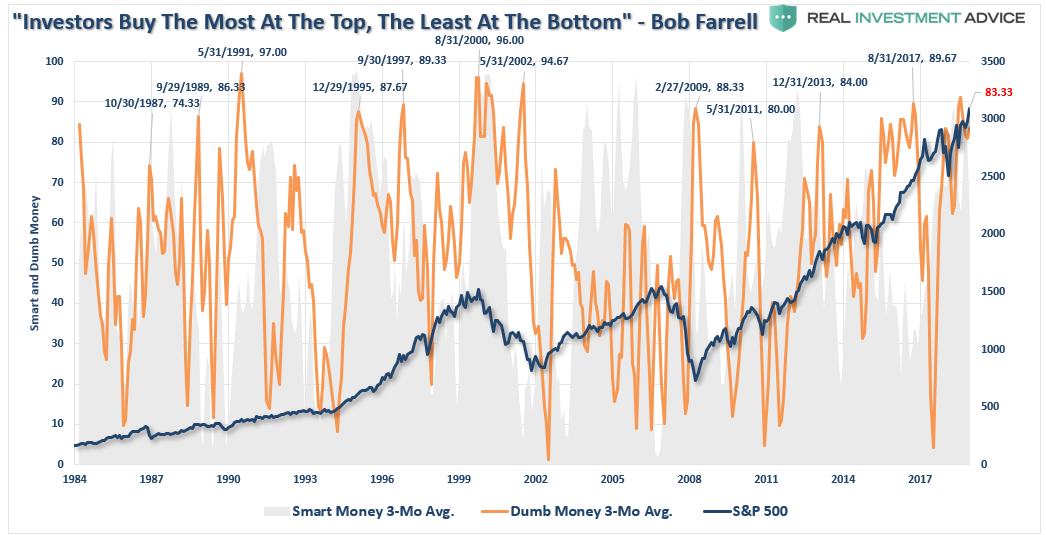
As with above, retail investors are
“all in” once again with the smart/dumb money indicator noting an extreme
bullish bias of retail investors.
See Chart:
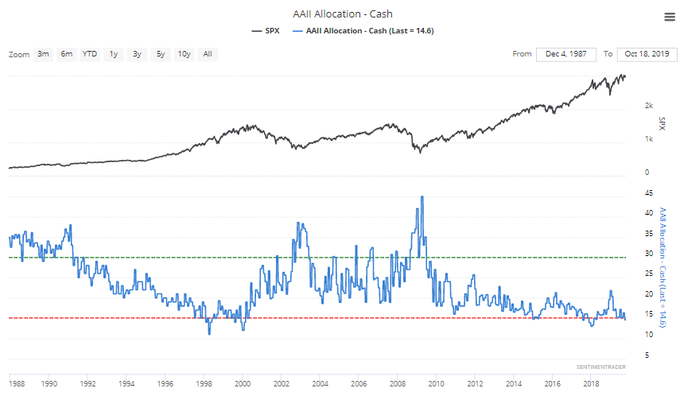
Of course, this coincides with extremely
low individual cash levels of individuals.
“With cash levels at the lowest level since
1997, and equity allocations near the highest levels since 1999 and 2007, it
suggests investors are now functionally ‘all in.’”
See Chart:
With net exposure to equity risk by individuals at
historically high levels, it suggests two things:
- There is little buying left from individuals to push markets marginally higher, and;
- The stock/cash ratio, shown below, is at levels normally coincident with more important market peaks.
However, even if we set aside
investor sentiment and positioning for a moment, the rapid reversion is price
has sent our technical composite overbought/oversold gauge back towards more
extreme levels of overbought conditions.
See Chart:
This is
why we have hedged our portfolios last week.
Does that mean we are bearish and betting on the market to
crash.
Not at all.
WHY WE
HEDGE
Currently, our portfolios are long-biased meaning we have
more equity-risk in our allocation than fixed income and cash.
Given the market’s advance, and the data points set out
above, and this
past Tuesday, we have three choices in how we manage our client
portfolios at this juncture:
- Do Nothing – if the markets correct, we lose some of our gains and just have to wait for the portfolio to recover.
- Take Profits – as we have done with extremely overvalued assets in the past, we can take profits, raise cash, and reduce our equity exposure in advance of a correction. Such actions mitigate the damage of the decline, but positions have to be repurchased, or new ones added, to resize the portfolio in the future.
- Hedge – adding a position to the portfolio that is the “inverse” of the market. (the position goes up in value as the market declines.) This action allows us to keep our existing positions intact, and by “shorting against the portfolio” allows us to effectively reduce our equity risk (and related capital destruction) during a market correction.
WHY DID WE
CHOOSE “OPTION 3” AT THIS JUNCTURE?
Option 1 – is never really a
good option. Riding the market up and down, and spending time “getting
back to even,” doesn’t make a whole lot of sense.
Option 2 – is something that
we took advantage of twice this year already. We took profits at the peak of
the market in May and July before both of the subsequent swoons. We also added
new exposures in early October. So, taking profits again in some positions
would lead to a gross underweight in certain areas of the portfolio allocation.
This makes
Option 3 the most optimal at this stage of the rally.
With the Fed engaged in pumping liquidity into the markets,
and any day may also include a random market manipulation from a “Trump
tweet,” the most opportunistic method to hedge
risk is to add a “short S&P 500” index position to the
portfolio. The chart below shows the range of options which we expect could
occur.
See Charts:
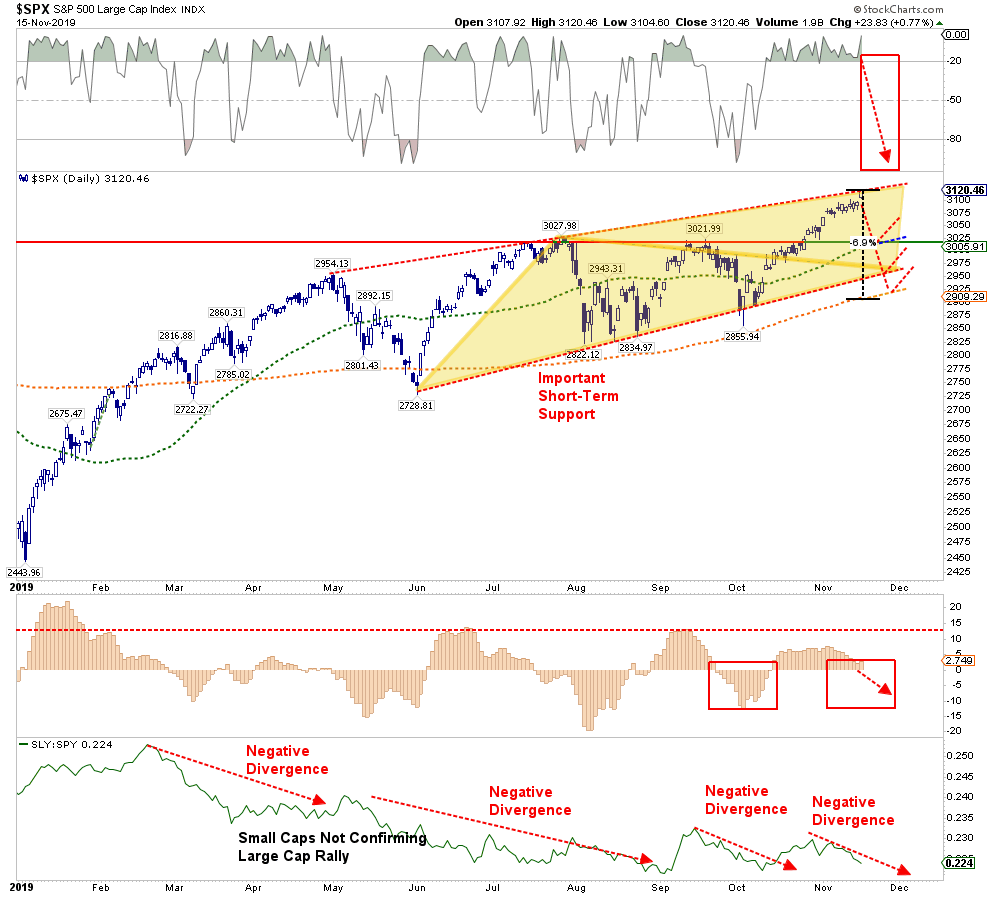
- Market breaks ABOVE the current upward trending range. We are currently carrying a stop at 3150 for our short position, where we will close it out. Yes, we will have a minimal loss in the position but the rest of our equity holdings will advance more than making up for the differential. (Example: On Friday, the S&P 500 increased .77%, our 60/40 Equity Portfolio with the Short Position rose by .46%)
- Market corrects to the currently rising 50-dma and in that process reverses the current overbought condition of the market (top panel, red box) back to oversold. Note: the 50-dma also currently coincides with the previous resistance of this year’s market highs. A retest of this level that holds, and removes the overbought condition as noted, would be very bullish. We will close out the hedge and increase our long-exposure.
- If the market breaks below the 50-dma, and is NOT oversold, the next level of support is the lower rising trendline. This is also important support, and a successful test that reverses the overbought condition would require a removal of hedges.
- The last support is the rising 200-dma. If the market test and holds the 200-dma, is oversold, and sentiment has returned to a more bearish position, we will close out our hedges.
- IF the market breaks below the 200-dma, we will likely be discussing the process of reducing long positions and increasing short-hedges.
Importantly,
the range of corrections discussed only runs 3-6%, which is well within the
normal confines of a bullish correction.
When we
discuss hedging against risk, it is invariably taken that we have sold
everything and are now betting on a market “CRASH.”
This is just how we manage risk.
You have a choice to either manage risk, or ignore it.
The only problem is that ignoring risk has a long history of
not working out very well.
….
----
----
US
DOMESTIC POLITICS
Seudo democ duopolico in US is obsolete; it’s full of frauds
& corruption. Urge cambio
"Small and mid-level independent businesses are squeezed by rising rents, minimum-wage
increases and mandatory sick leave..."
====
"You have an
over-militarization of police departments all across the country,
racially unjust application of laws
against poor black and brown people..."
====
Farm bailouts
With every
farm bailout, more truth comes out of how disastrous the trade war has been for
US farmers.
====
US-WORLD ISSUES (Geo Econ, Geo Pol & global Wars)
Global depression is on…China, RU, Iran search for State
socialis+K-, D rest in limbo
"What has happened everywhere in the world is that nothing is any longer important but money.
Therefore, everything is sacrificed for money. There is no shame, no honor, no integrity, no truth, no justice..."
====
It is easy
to forget that capital enters and exits nations only with the express
permission of those in power.
====
You set up
a Japanese shell company, get a bank account. Then you transfer renminbi to
your company’s bank in Tokyo, settled in Yen. At that point, the money
basically vanishes.
====
SPUTNIK and RT SHOWS
GEO-POL n GEO-ECO
..Focus on neoliberal expansion via wars & danger of WW3
----
----
NOTICIAS IN SPANISH
Lat Am search f alternatives to neo-fascist regimes &
terrorist imperial chaos
VIDEOS:
Am
Lat: BOL Que pasó con Bolivia https://m.youtube.com/watch?V=6DdN
…
Am
Lat LA CLASE MEDIA: Juan Pablo Feinmann y Caso Bolivia:
…
---
REBELION
…
….
RT
EN ESPAÑOL
…
…
…
…
...
https://actualidad.rt.com/actualidad/334023-alberto-fernandez-impulsar-legalizacion-aborto-argentina
…
--
…
…
...
…
----
----
INFORMATION CLEARING HOUSE
Deep on the US political crisis: neofascism & internal
conflicts that favor WW3
-Evo Overthrown, But Bolivian Socialism Will
Be Victorious! By Andre
Vltchek
-Coming to Terms With the US Role in Central
America By César Chelala
-Vladimir Putin: US Dollar Will Collapse Soon By Tyler Durden
-Why Are We in Ukraine? By Stephen F. Cohen
----
----
COUNTER PUNCH
Analysis on US Politics & Geopolitics
Melvin Goodman Meet
Ukraine: America’s Newest “Strategic Ally”
Kathleen Wallace Gangster
Capitalism: Next Up, Bolivia
Nino Pagliccia EVO:
Bolivia Suffers an Assault on the Power of the People
Clark T. Scott Bolivia
and the Loud Silence
----
----
GLOBAL RESEARCH
Geopolitics & Econ-Pol crisis that leads to more
business-wars from US-NATO allies
-It’s
Official: Dysfunctional Impeachment Resolution against Donald J. Trump. H. RES.
13 By Prof Michel
Chossudovsky,
----
----
PRESS TV
Middle East & world News
- Trump 'doesn’t like losers' like Netanyahu
- Bolivian interim leader says elections to be held soon
- Russia returning seized Ukrainian ships: report
- 'Western, Saudi-funded media fueling unrest in Iran'
- Zarif lauds Palestinian resistance against Israel
- 'Sheikh Zakzaky in detention not on his own will'
- Trump attacks Pence aide amid Ukraine scandal
- Fire and fury at Hong Kong's cross harbor tunnel
- Euro 2020 qualifiers: Luxembourg 0-2 Portugal
- ‘Feigned US concern for Iranians is pure hypocrisy’
- Why Israel seeks to start war on Gaza?
- PROGRAMS
- Corrupt to core
- Gasoline price hike in Iran
- US wars: civilian casualties and mounting costs
- Interview with Levan Dzhagaryan
- Yellow vest protests anniversary
----
===
No hay comentarios:
Publicar un comentario