ND
MAR 29 19 SIT EC y POL
ND denounce Global-neoliberal debacle y propone State-Social
+ Capit-compet in Eco
ZERO HEDGE ECONOMICS
Neoliberal globalization is over. Financiers know it, they
documented with graphics
US Economic situation today:
Summarizing
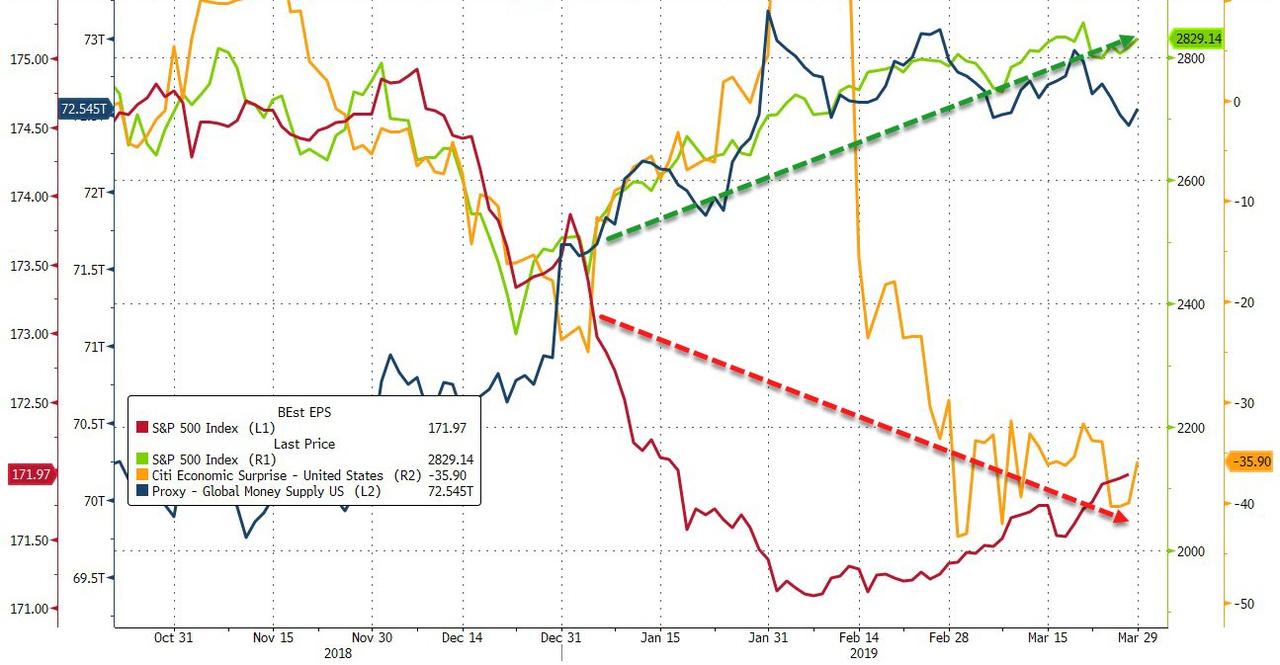
Q1 in one chart: Stocks soared
alongside a renewed surge in global money supply as top-down and bottom-up
fun-durr-mental data collapsed...
See Chart:
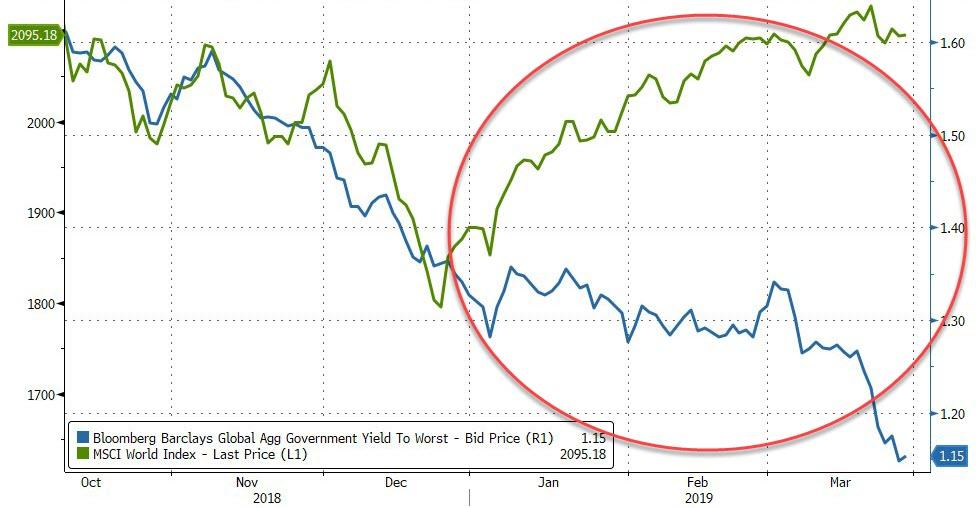
Global stocks and global bond yields
have decoupled dramatically in Q1...
See Chart:
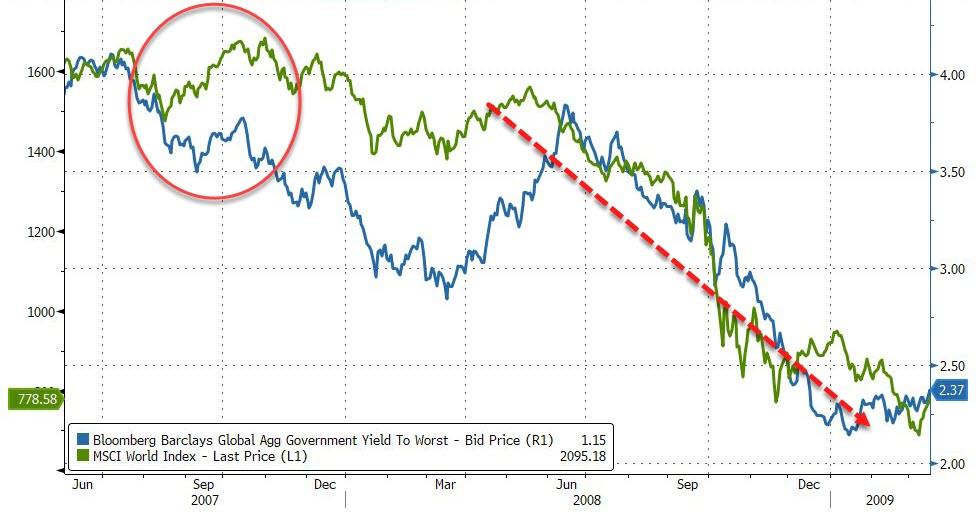
We have seen this before...and it
did not end well.
See Chart:
Quite a quarter!
- Best quarter for world stocks since 2012
- Best quarter for US stocks since 2009
- Best quarter for oil since 2009
And...
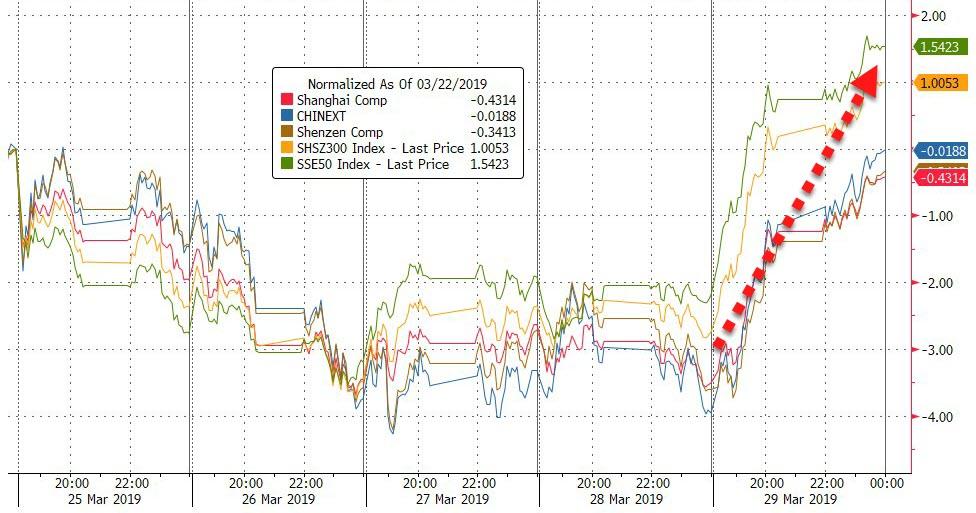
Chinese stocks were panic bid
overnight, ending the quarter up 24% (China's
best quarter since Q4 2014, and best Q1 since 2009)... while EU
Ec went up too
See Chart:
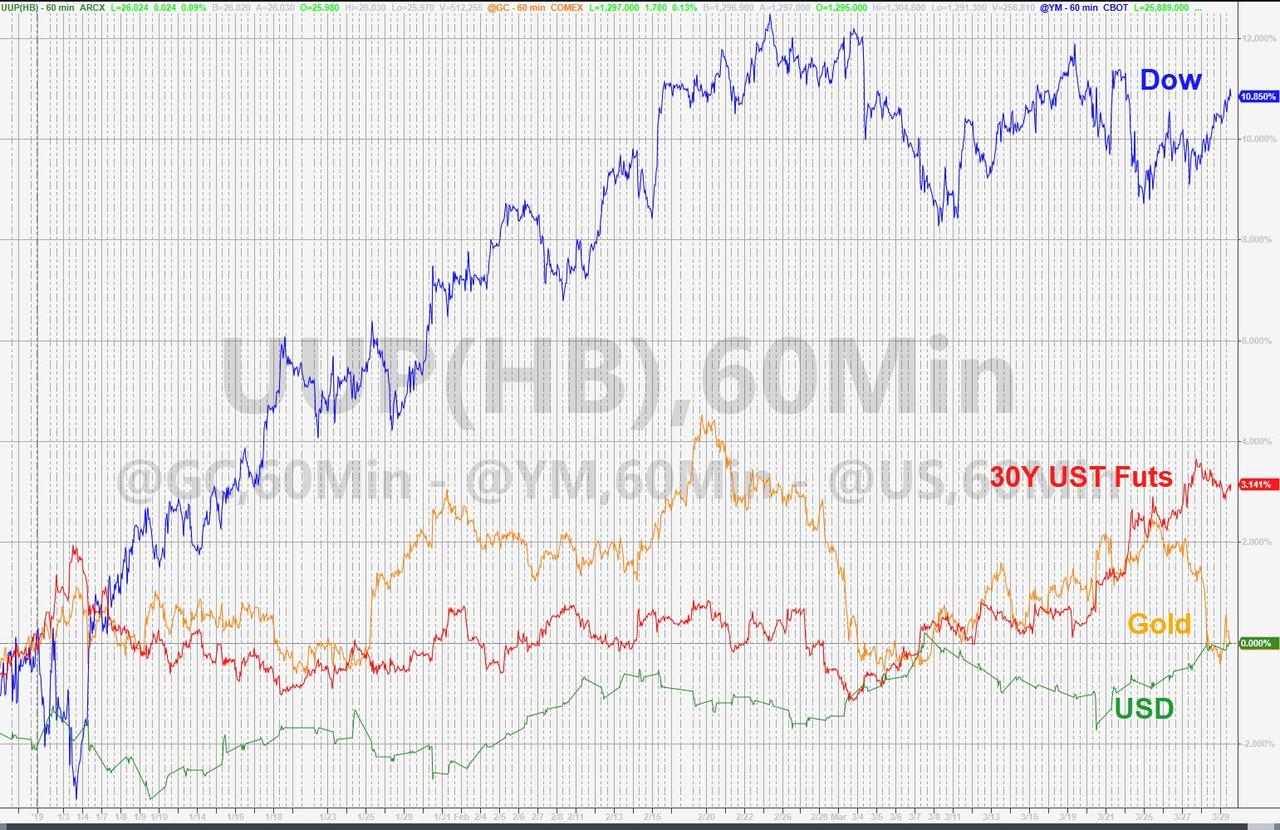
US Stocks outperfomed bonds
dramatically as Gold and the dollar ended unchanged in Q1...
See Chart:
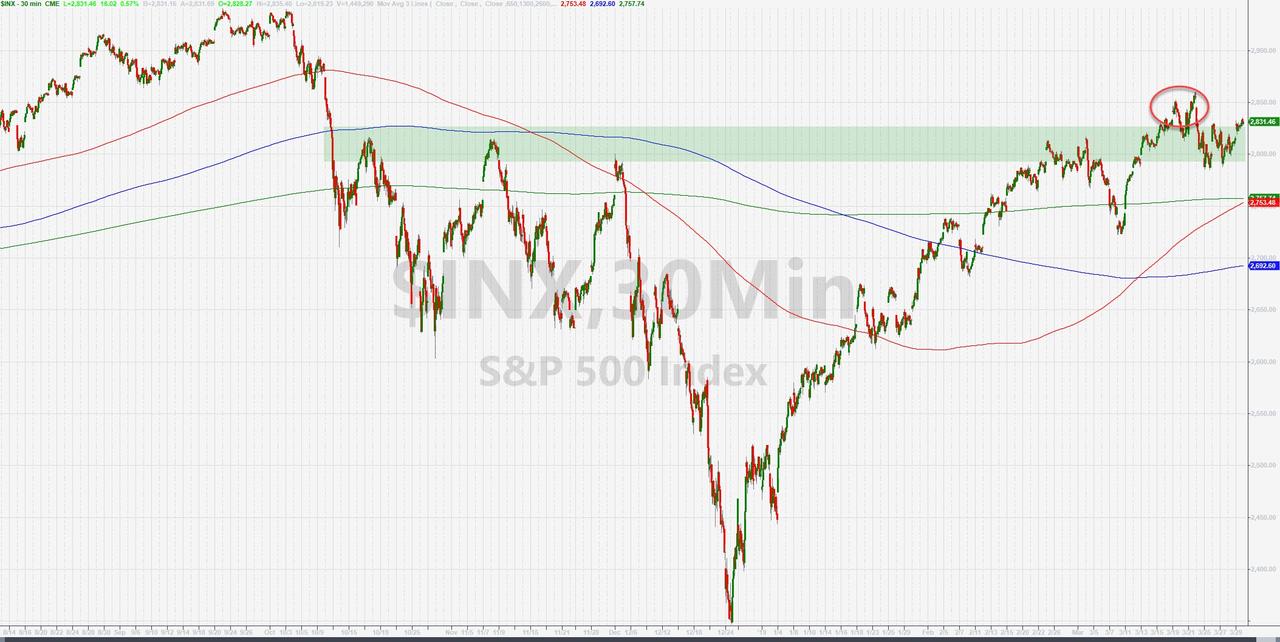
The S&P 500 manage to get back
above 2800 but is still struggling to follow-through...
See Chart:
LYFT IPO opened at $87.24 (after
pricing at $72) but faded from the open...they defended $80 but that broke into
the close...
See Chart:
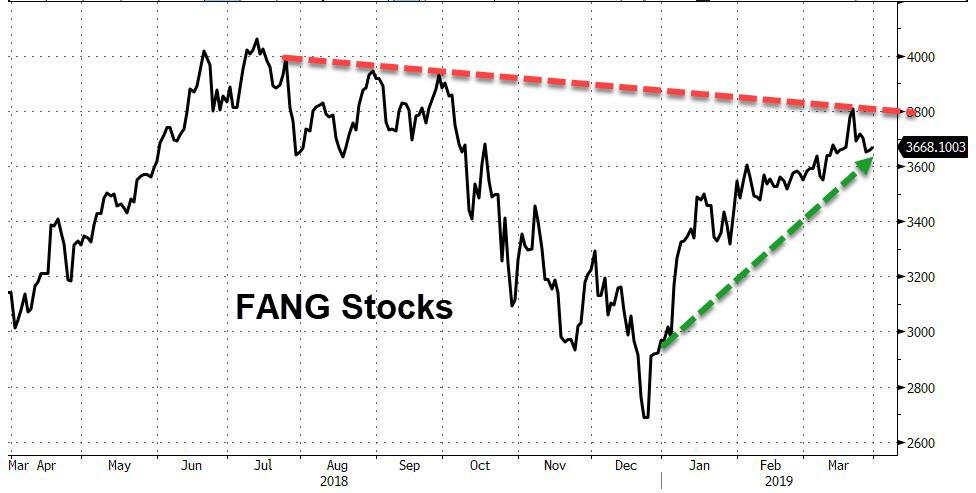
FANG stocks soared in Q1 by 23.5% -
the best quarter since Q3 2013
See Chart:
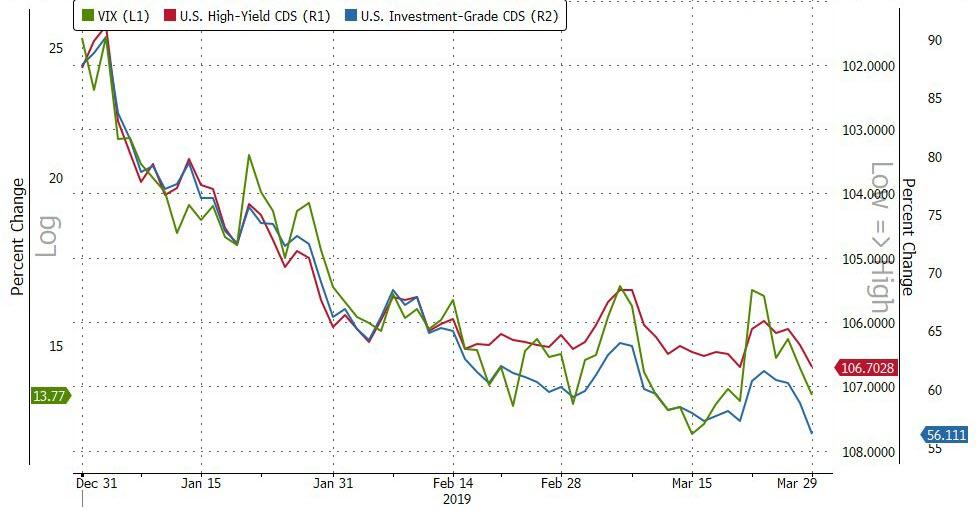
Credit (HY CDX -100bps, IG CDX
-24bps, biggest quarterly drop since Q1 2012) and equity (VIX -11.6 vols,
biggest Quarterly drop since Q4'11) protection costs collapsed in Q1...
See Chart:
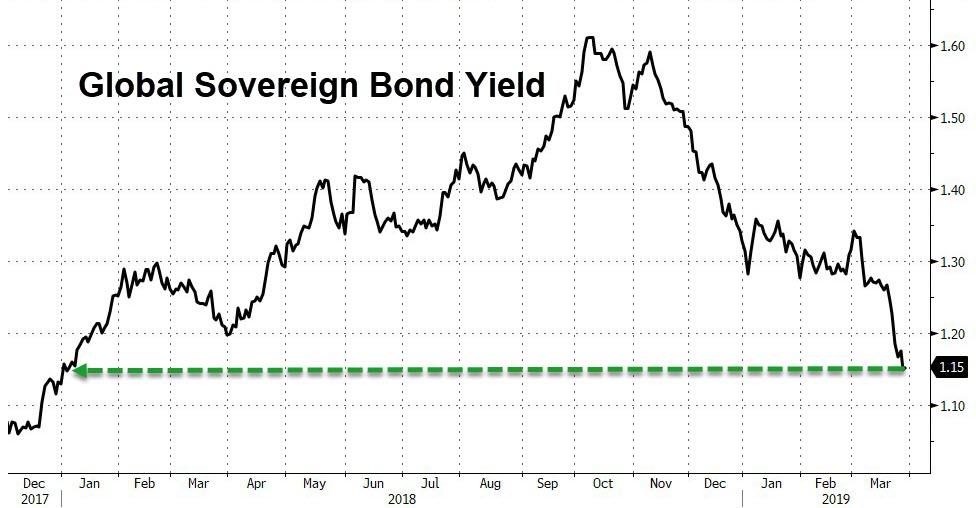
Global sovereign bond yields plunged
in Q1 (and Q4 2018) to their lowest since Jan 2018... (this is the biggest 2Q
drop in sov yields since the growth crisis in 2016)
See Chart:
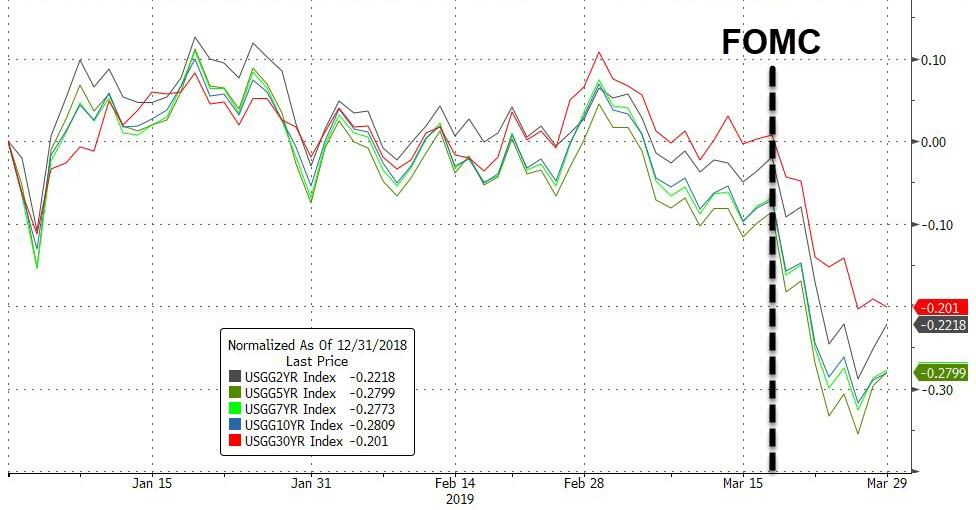
US Treasury yields plunged in Q1
(extending Q4's collapse)...
See Chart:
30Y Yields are below 3.00%, 10Y
below 2.50%, and the rest of the curve plunged...
See Chart:
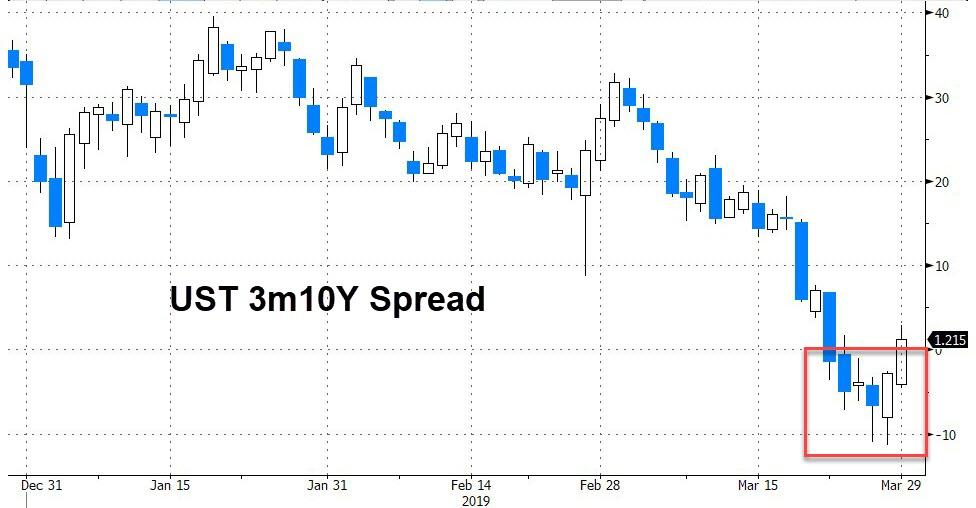
The US yield curve has now flattened
for 8 of the last 9 quarters, plunging into inversion this week...
See Chart:
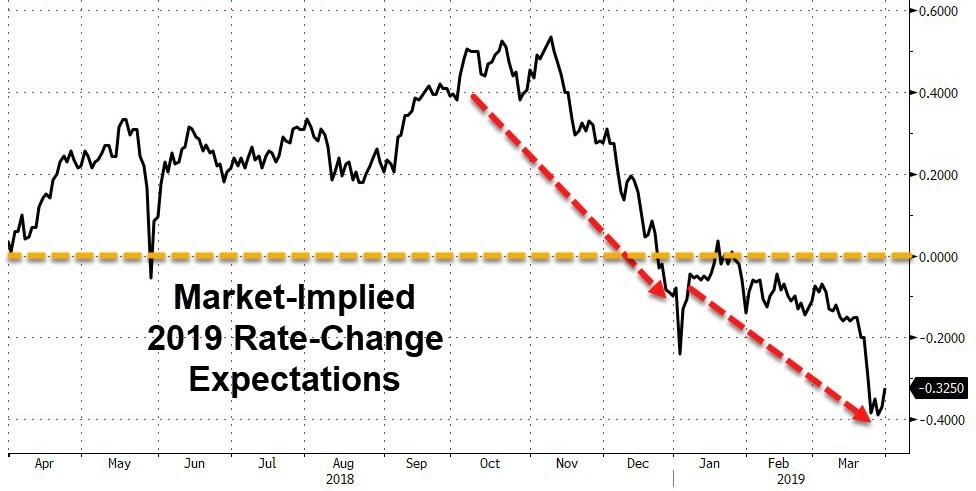
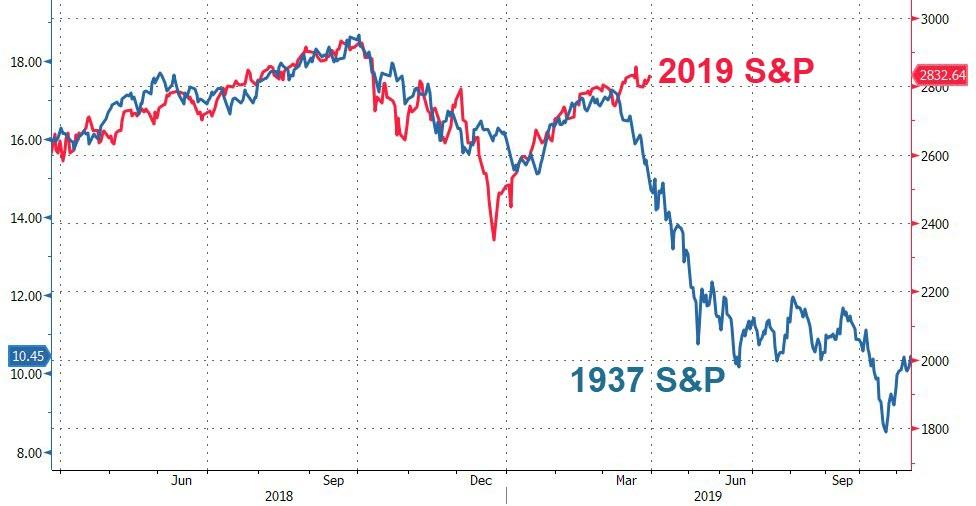
Finally, we note that the markets
have seen an unprecedented swing in their outlook for The Fed...
Rescuing stocks (for now) from their
1937 analog...
…
SOURCE: https://www.zerohedge.com/news/2019-03-29/global-stocks-surge-best-quarter-2012-bond-yields-plunge
----
----
The controversy converted the inflation index from a "cost of
things" to a "cost of living" index. However, in reality, today’s inflation index is not a true
"cost of living" index as it’s missing important items, such as
financial assets.
Submitted
by Joseph Carson, Former
Director of Global Economic Research, Alliance Bernstein.
Inflation has often been involved in political controversy,
but today the pendulum has swung from politicians to monetary policymakers.
Politicians used the controversy over high inflation to force change in its
measurement. Monetary policymakers are using the controversy over low inflation
to force change in its policy guidance.
As monetary policymakers have become enmeshed in the
politics of the numbers it is important to understand
how the politics of inflation has shaped its measurement. Inflation for politicians is to be as low as
possible, while inflation for policymakers is to be as accurate as possible.
Those two are not always the same, and policymakers mistook it to be
true during the housing boom and failed to recognize market price signals. Are
policymakers risking making the same mistake again?
The relationship
between the two methods is not constant since
"cost of living" is more of an academic concept and not based fully
on market prices.
The politics of inflation often involved discussions over
which approach to employ for the indexation of social programs, and politicians
oftenfavored
whatever approach yielded low inflation.
See Chart:
For example, in the early 1980s, consumer inflation (CPI),
based on the "costs of things" framework, was driving up the federal
government costs of indexation for social programs and the controversy over
measurement provided Congress a convenient format to use its statistical
policy-making role to force change, while also trying to reduce the budget
deficit. The controversy ended with Congress endorsing
its first shift towards a "cost of living" framework as it
recommended removing actual house prices and replaced them with a subjective
measure of owner’s rents.
The politics of inflation erupted again in the mid-1990s
when Federal Reserve Chairman Alan Greenspan told Congress the current measure
of inflation was over-stating actual inflation by a full percentage point,
costing the federal government billions in its indexation of government social
programs. Congress
demanded immediate action, with one piece of legislation going as far as
holding back on appropriations for the government statistical agencies until it
lowered the inflation index.
Soon
after, with Congress insistence government statisticians started to implement
various statistical changes in measurement, moving the inflation index one
large step closer to the concept of "cost of living".
The politics of inflation demonstrated how politicians have
used their political clout to lower reported inflation. While there were
legitimate issues of concept and design involved in both debates, political
opinion was mainly shaped by the dollars to be saved at the federal government
level if the inflation index were to increase more slowly.
The
controversy converted the inflation index from a "cost of things" to
a "cost of living" index. However,
in reality, today’s inflation index is not a true
"cost of living" index as it’s missing important items, such
as financial assets. So, in practice, the inflation index is mishmash, or a
hybrid, as it includes actual prices with "imputed" prices.
See Chart:
Asset Prices Inflation has been high
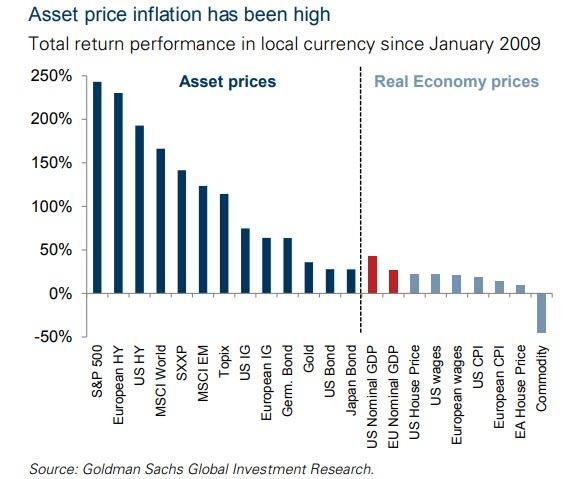
A hybrid inflation index is not appropriate for monetary
policy as the focus needs be on the actual "cost of things." And
targeting a hybrid index becomes a problem when there is a great variance
between actual prices and imputed prices as evident in the 2000s when house
prices skyrocketed and "imputed" rents hardly moved. That trend is also present today
but on a smaller scale, suggesting the "cost of things" has been
moving up at a faster rate compared to the "cost of living".
Policymakers should borrow a page from the politicians
playbook and conduct a study of price measurement to ensure today’s measures
meets their purpose of economy wide inflation. It would also be wise to examine
why asset price cycles have been much greater since the shift towards a
"cost of living" index and numerical price targeting. Politics of inflation should never favor one type over
another as history has clearly
shown easy money creating or promoting inflation in only two areas (real and
financial assets) can be just as bad economically and financially as if it
shows up in all of the items.
….
----
RELATED:
This is a disturbing image reminiscent
of the Weimar Republic. Regardless of where it happens, hyperinflation
invariably equals economic
destruction.
----
----
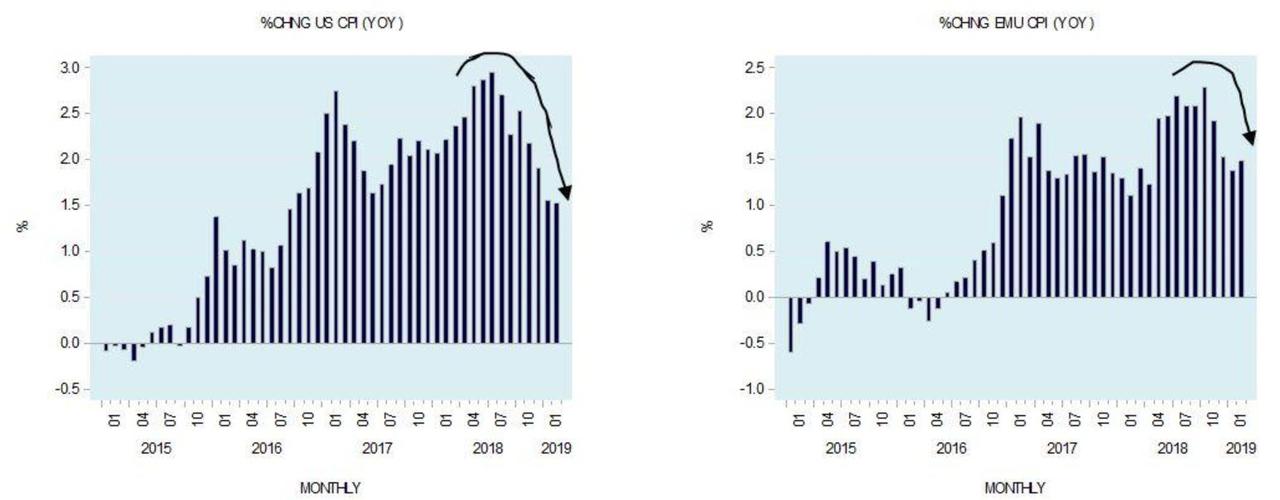
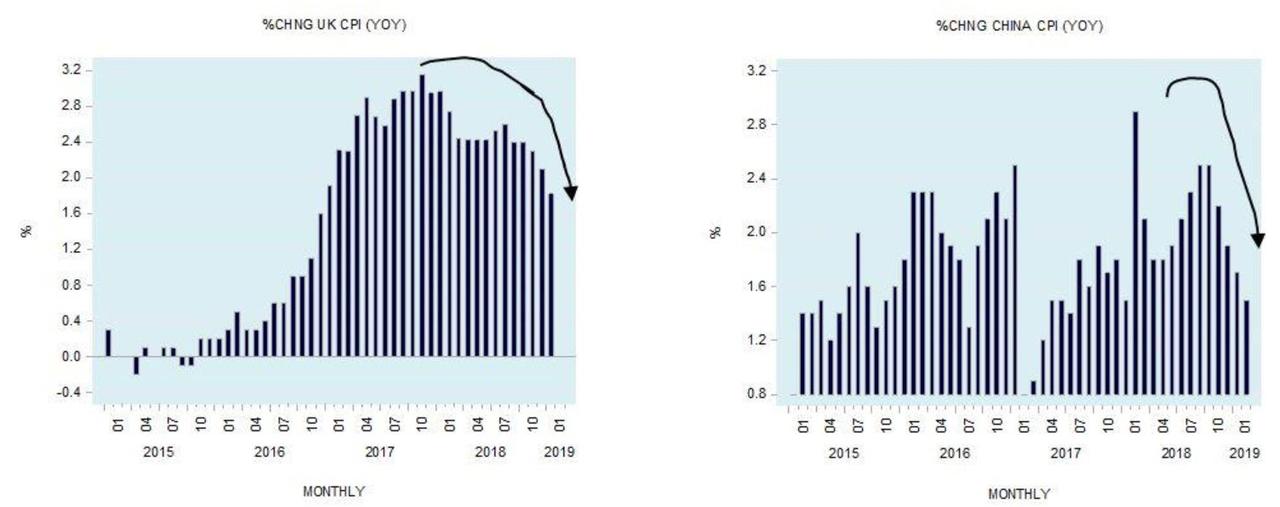
...contrary to the popular view, a fall in the growth momentum of prices is always good news for
the wealth-generating process and hence for the economy.
Currently
we can observe a general slowdown in the annual growth rate in price inflation
across major countries around the world. For instance the yearly
growth rate of the US consumer price index (CPI) fell to 1.5% in February from
1.6% in January and 2.2% in February last year. In Europe, the yearly growth
rate of the EMU CPI stood at 1.5% in February versus 1.4% in January and 2.3%
in October 2018.
See Charts:
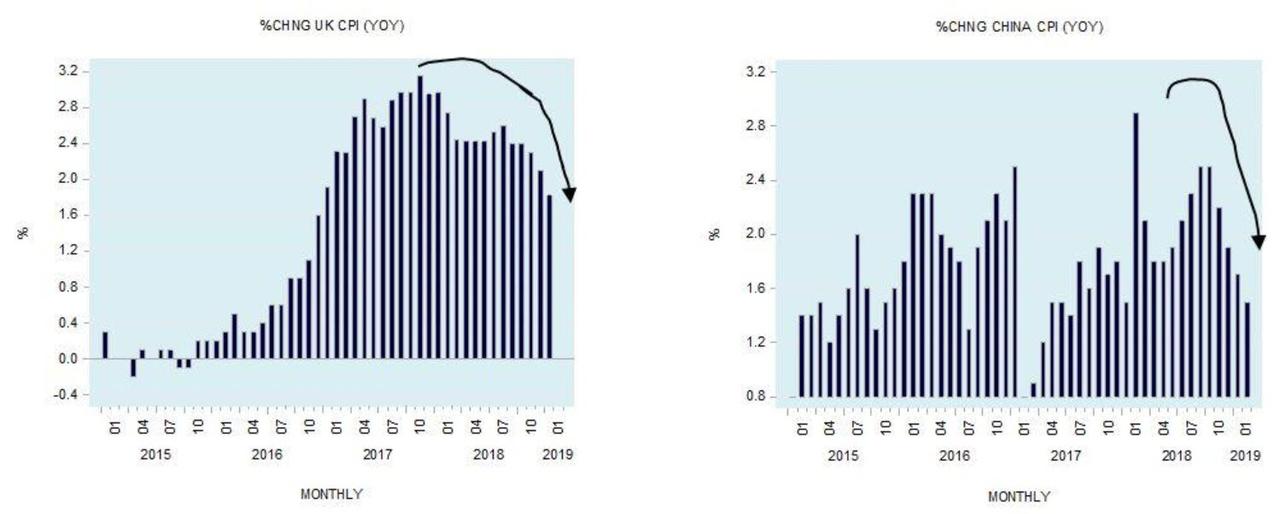
The annual rate of China’s CPI has also eased in February
falling to 1.5% from 1.7% in January and 2.9% in February the year before. The growth momentum of the UK CPI also displays softening
with the yearly growth rate standing at 1.8% in February against 2.1% in the
month before and 3% in January 2018.
See Charts:
Most commentators are of the view that deflation generates
expectations for a decline in prices. As a result, it is held, consumers are
likely to postpone their buying of goods at present since they expect to buy
these goods at lower prices in the future. This weakens the overall flow of
spending and in turn weakens the economy.
Hence, such commentators believe that policies that counter
deflation will also counter the economic slump.For many commentators and
economic experts to counter a decline in the annual growth of the CPI, which
they fear could develop into a general decline in prices; they advocate that
central banks should maintain a very loose monetary stance. For these
experts a possible decline in prices — which they label as deflation
— poses a major threat to the economy.
See Charts:
It would appear that if deflation leads to an economic slump
then policies that reverse deflation should be good for the economy. Reversing
deflation will simply involve introducing policies that support general
increases in the prices of goods, (i.e., price inflation). By this way of
thinking, inflation could actually be an agent of economic growth.
According
to most experts, a little bit of inflation can actually be a good thing. Mainstream economists believe that inflation of
2% is not harmful to economic growth, but that inflation of 10% could be bad
for the economy.
Why should
a rate of inflation of 10% or higher be regarded as a bad thing? If anything at inflation rate of 10% it is
likely that consumers are going to form rising inflation expectations, and
according to popular thinking, in response to a high
rate of inflation, consumers will speed up their expenditure on goods at
present, which should boost economic growth. Clearly, there is a problem with
the popular way of thinking.
Inflation Is not
Essentially a Rise in Prices
Inflation is not about general increases in prices as such,
but about the increase in the money supply. As a rule, the increase in money
supply sets in motion general increases in prices. This, however, need not
always be the case.
The price of a good is the amount of money asked per unit of
it. For a constant amount of money and an expanding quantity of goods, prices
will actually fall. Prices will also fall when the rate of increase in the
supply of goods exceeds the rate of increase in the money supply.
For instance, if the money supply increases by 5% and the
quantity of goods increases by 10%, prices will fall by 5%.
Now,
consider a situation in which money is created out of "thin air." This new money is no
different from counterfeit money. The counterfeiter exchanges the printed money
for goods without producing anything useful. He in fact exchanges nothing for
something. He takes from the pool of real goods without contributing to the
pool.
The
economic effect of money that was created out of thin air is the same as that
of counterfeit money — it impoverishes wealth generators.
The money created out of thin air diverts
real wealth towards the holders of new money. This weakens wealth
generators ability to generate wealth and this in turn leads to a weakening in
economic growth. Note that as a result of the increase in the money supply what
we have here is more money per unit of goods, and thus, higher prices.
What
matters, however, is not price rises as such but the increase in money supply
that sets in motion the exchange of nothing for something or "the counterfeit
effect."
Furthermore, if a fall in the growth momentum of prices emerges on the
back of the collapse of bubble activities in response to a softer monetary
growth, then this should be seen as good news. The less non-productive bubble
activities the better it is for the wealth generators and hence for the overall
pool of real wealth.
Likewise, if a fall in the
growth momentum of the CPI emerges because of the expansion in real wealth for
a given stock of money, obviously this is great news since more people could
now benefit from the expanding pool of real wealth. We can thus conclude that
contrary to the popular view, a
fall in the growth momentum of prices is always good news for the wealth-generating process and hence for the
economy.
…
----
----
You can spend more money
than you are bringing in for quite a while, but eventually a day of reckoning arrives.
The United
States is on a path to financial ruin, and everyone can see what is happening,
but nobody can seem to come up with a way to stop it. According to the U.S. Treasury, the federal
government is currently 22 trillion dollars in debt,
and that represents the single largest debt in the history of the planet.
Over the past decade, we have been adding to that debt at
a rate of about 1.1 trillion dollars a year, and we will add more than a
trillion dollars to that total once again this year. But when you add in
our unfunded liabilities, our long-term financial outlook as a nation looks downright
apocalyptic. According to Boston University
economics professor Laurence Kotlikoff, the U.S. is currently facing 200
trillion dollars in unfunded liabilities, and when you add that number to our
22 trillion dollar debt, you get a grand total of 222 trillion dollars.
Of course we are never going to pay back all of this debt.
The truth
is that we are just going to keep accumulating more debt until the system
completely and utterly collapses.
When you add it all
together, the total amount of debt in our society is
well above 300 percent of GDP, and it keeps rising with each passing year.
Our exploding debt is an existential threat to our nation,
and we are literally destroying the bright future that
our children and our grandchildren were supposed to have.
Boston University economics professor Laurence Kotlikoff has
been studying our unfunded liability crisis for many years, and according to
him the real number is
200 trillion dollars…
Consumers will largely bear the brunt of the country’s financial ruin,
according to Kotlikoff, which is why it is crucial to give them the power to
make better financial decisions.
While the United States’ official debt is $20 trillion, the fiscal gap
is really 10 times larger — $200 trillion. That comes from adding in
off-the-book liabilities, including debt that’s in the Federal Reserve’s hands,
Kotlikoff said.
If Kotlikoff is correct, that means that the true size of the financial
obligation that we are imposing upon future generations is 222 trillion
dollars, and that number just keeps rising month after month.
….
----
----
US
DOMESTIC POLITICS
Seudo democ duopolico in US is obsolete; it’s full of frauds
& corruption. Urge cambio
More troubling is that 37
million Americans had a 90-day delinquent strike added to their credit report last
quarter...
====
The American dream has morphed
into the American grift. And we normal people are the marks...
====
US-WORLD ISSUES (Geo Econ, Geo Pol & global Wars)
Global depression is on…China, RU, Iran search for State
socialis+K-, D rest in limbo
ALL TIMERS way of thinking:
Bolton
unsheathes the Monroe doctrine...
…
Of course RU & China won’t pay
attention to this “b..t”. They’re ready to resp
====
Beijing is not backing down on its demands that all tariffs imposed
since the start of the trade war be lifted as part of any trade pact with the
US...
====
Real Economics on US:
"Yea, you need a 50bp rate cut, cause otherwise the math doesn’t work..."
“I don’t think the underlying economy is
slowing” when
everyone with a brain and basic understanding of data knows it is.
It’s cheerleading and playing the confidence game, while at the same
time demanding a 50bp rate cut by the Fed, an utterly ridiculous suggestion
especially in light of the earlier statement.
Getting the Fed to
stop the balance sheet rolloff and to stop rate hikes was the first obvious
step and the Fed acquiesced claiming to be data dependent.
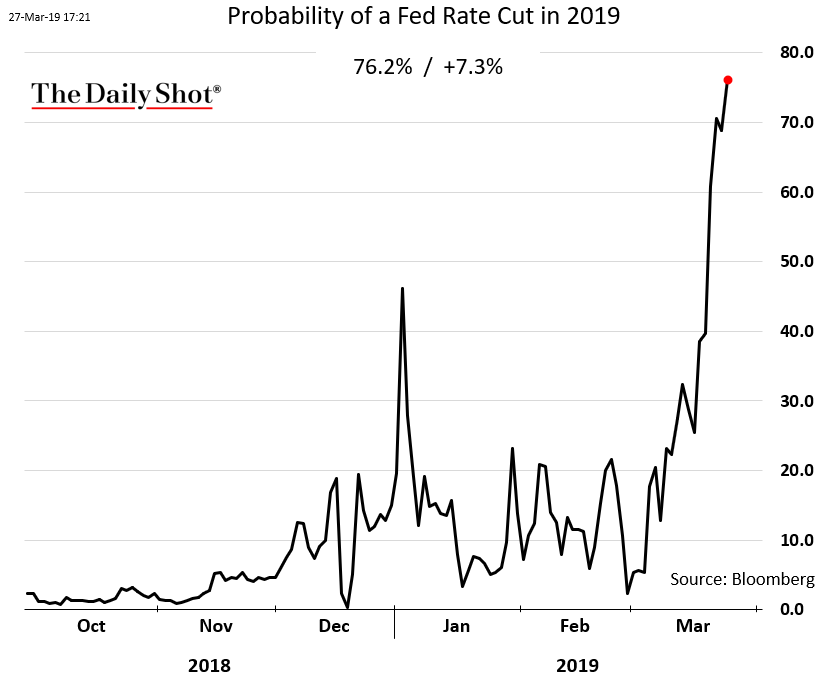
The second step: Get the Fed to cut
rates. Markets are already pricing
in a rate cut for 2019:
See Chart:
The Daily Shot
But see this:
See Chart:
This is a recessionary image
That’s recessionary risk this late in the cycle. But Larry Kudlow apparently thinks
a recession can get averted by juicing markets with more cheap money.
You know what else is recessionary?
This:
See Chart:
Oh it’s just the tax cuts. Really? Weren’t tax cuts supposed
to bring in all this growth that would pay for itself?
It hasn’t and it won’t, but the
spread between increased government spending and reduced government income is
widening the most since, well, the last recession:
See Chart:
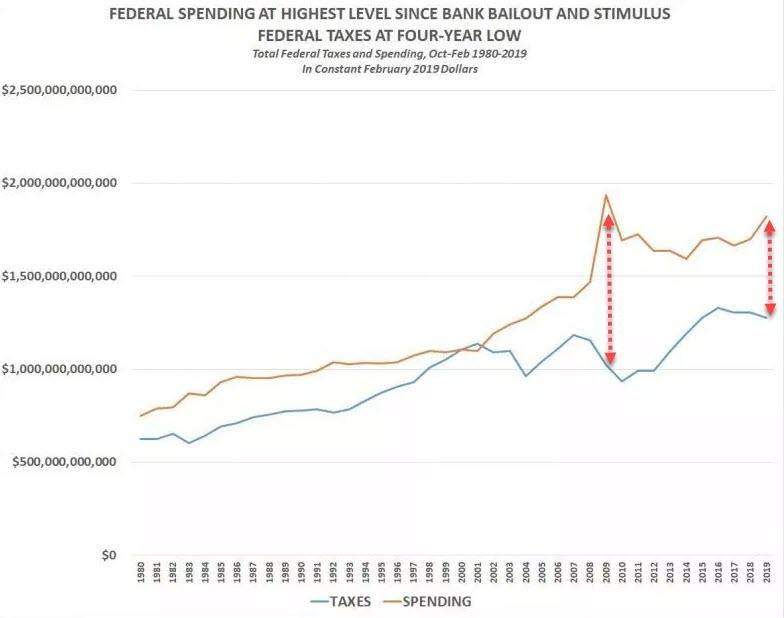
Yea, you
need a 50bp rate cut, cause otherwise the math doesn’t work.
To say that would be honest. But instead you get two faced
nonsense. Don’t fall for it. Recession coming is a real risk here. But nobody will admit it.
For the latest
public analysis please visit NorthmanTrader.
…
----
----
SPUTNIK and RT SHOWS
GEO-POL n GEO-ECO
..Focus on neoliberal expansion via wars & danger of WW3
====
SHOWS RT
----
----
NOTICIAS IN SPANISH
Lat Am search f alternatives to neo-fascist regimes &
terrorist imperial chaos
ALAI ORG
====
RT EN
ESPAÑOL
- Trump le pidió a Kim transferir sus armas nucleares a EE.UU.
- EE.UU. considerará el despliegue de fuerzas armadas de otros países en Venezuela "como una amenaza directa a la paz"
- Elliott Abrams afirma que "Rusia pagará" por su apoyo a Maduro
- Cuadrillas VEN de paz realizan ejercicios de defensa en todo el país
- ¿Cómo sale a la luz un diario VEN en medio de la oscuridad o apagón?
- Venezuela recibe 65 toneladas de medicament provenientes de China
- RU abre un centro para entrenar pilotos de helicópteros en Venezuela
- López Obrador responde a Trump por crisis en la frontera
- Trump arremete contra I Duque: " más drogas salen de COL Ahora"
- Apple cancela su ambicioso proyecto de carga inalámbrica AirPower
- 2019 : fin de los tiempos: video muestcómo será la desap del Universo
- "Presos políticos" y "exilio", palabras prohibidas en Cataluña
Keiser Report ¿El fin de Silicon Valley?
----
----
INFORMATION CLEARING HOUSE
Deep on the US political crisis: neofascism & internal
conflicts that favor WW3
====
COUNTER PUNCH
Analysis on US Politics & Geopolitics
Jeffrey St. Clair Roaming
Charges: Rachel Maddow and the Muellers Invention
Andrew Levine Democratic
(Party) Socialism
====
GLOBAL RESEARCH
Geopolitics & Econ-Pol crisis that leads to more
business-wars from US-NATO allies
====
DEMOCRACY NOW
Amy Goodman’ team
====
PRESS TV
Resume of Global News described by Iranian observers..
----
===
No hay comentarios:
Publicar un comentario