ND MAR 17 19 SIT
EC y POL
ND denounce
Global-neoliberal debacle y propone State-Social + Capit-compet in Eco
ZERO
HEDGE ECONOMICS
Neoliberal
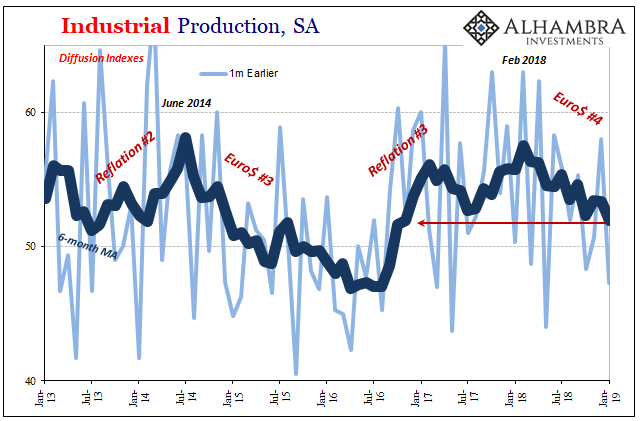
globalization is over. Financiers know it, they documented with graphics
It’s not just “hard” data, either...
The Federal
Reserve, as part of its data on Industrial Production, calculates just such a
diffusion index (lagged by one month, meaning the updated diffusion indices are
for January 2019). The
monthly numbers are volatile and noisy, the average however unmistakable in
timing and interpretation.
Even the ISM’s PMI for the manufacturing sector has
tended to follow, not lead, the Fed’s diffusion numbers.
See Chart:
…
----
----
by Tyler Durden
The Fed's March 19-20 two day
meeting will be to many at the FOMC a crash course in humility. Here's why.
Back in
December, when Powell infamously stated that the Fed's balance sheet unwind is
on "autopilot", a statement the Fed Chair promptly came to regret
just a few days later when the S&P briefly tripped into a bear market
before staging a historic rebound after Powell reversed dovishly on every
possibly occasion, the Fed indicated in its Summary of Economic Projections
that the US economy is growing at a solid pace, with GDP expected to reach 2.3%
in 2019 as the unemployment rate tumbled to 3.5% even as 2019 Core inflation
remained subdued at just 2.0%, a drop from the 2.1% projected at the prior,
September, SEP forecast.
See
Chart:
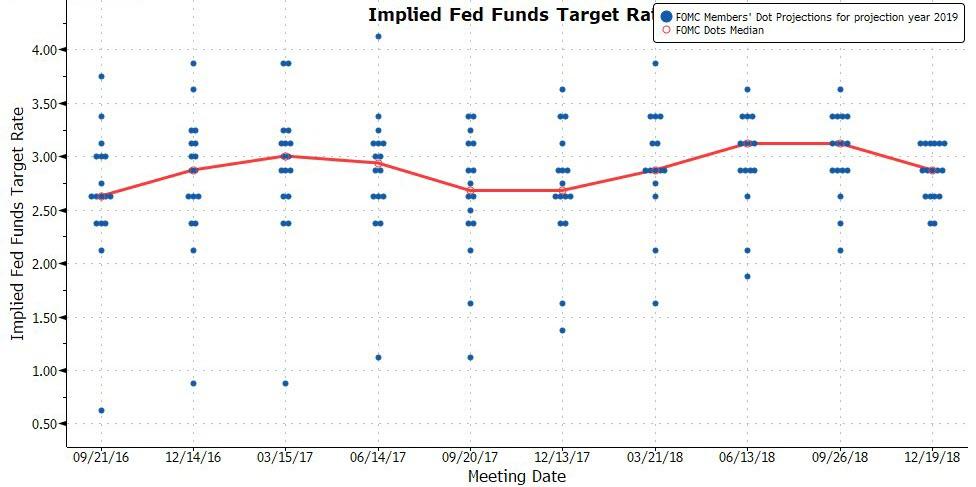
But
more importantly, the Fed also revealed that it expects at least 2 more rate
hikes in 2019 (down from 3 in September), which would see the Fed Funds rise to
3.1% in Dec. 2019, and another rate hike in 2020 bringing the US rate to 3.1%
at which point it would peak before drifting lower to its longer-run rate of
2.8%.
See Chart:
In a
February Bloomberg op-ed, Mohamed El-Erian made the case to eliminate the dots,
when Bill Gross' former partner suggested the Fed could consider following the
template of the Bank of England's "Inflation Report," which releases
a complete staff assessment of monetary policy conditions with fan charts
rather than point estimates. This gives more detail about the Fed's reaction
function and takes out the perceived precision of the dots.
In
retrospect, following the huge hit to the Fed's credibility that Powell's 180
degree reversal in the past three months created, it would certainly be
convenient to make the dots more conditional and scenario-based at this point
in the cycle. As Mester noted, the Fed has returned to "normal"
monetary policymaking, which means the outlook will be more conditional on the
outlook and less programmatic.
However, as
BofA warns, removing the dots at this
point would be helpful in the near term, but hurtful in the long run. When
the time comes to cut rates again, the Fed is likely to return the ZLB quickly.
The dots will then become a critical tool for the Fed who will otherwise have
limited ammunition. It is possible the Fed could stash the dots away during
good times and reintroduce them in downturns, but that only adds to the Fed's
credibility challenges. Moreover, such a move would
need consensus within the FOMC and many still see benefits in releasing the
dots.
How
will this happen?
Looking at
the distribution of the dots, only
three FOMC officials would need to shift from two hikes this year to one hike
to move the median to one hike for 2019. That's the easy part; the difficult part is that no less than seven
officials would need to move to get the median to zero for this year which - as
BofA concedes - is a "much harder case to make", especially
without sparking fresh recession fears.
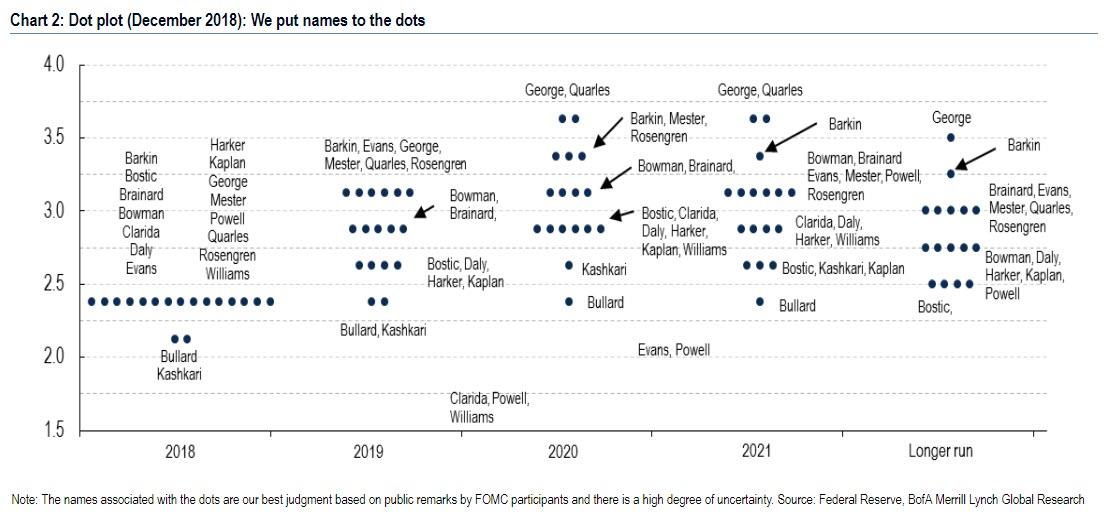
According to BofA's "dot exercise" the "core"
members of the FOMC were likely forecasting two hikes for this year in December
(Bowman, Brainard, Clarida, Powell, and Williams). Based on speeches since then, it appears these Fed officials
are all at risk of revising down their outlook for the path of policy. Other
Fed officials we pegged at three hikes in 2019 (eg, Evans) could also make the
move down to one hike.
See Chart:
So once
again the dots will be confusing.: while the median will likely still show
hikes in the outlook (absent a shocking capitulation by most on the FOMC), the
core of the committee, which holds the trifecta, will likely shift lower,
perhaps removing all hikes for the year.
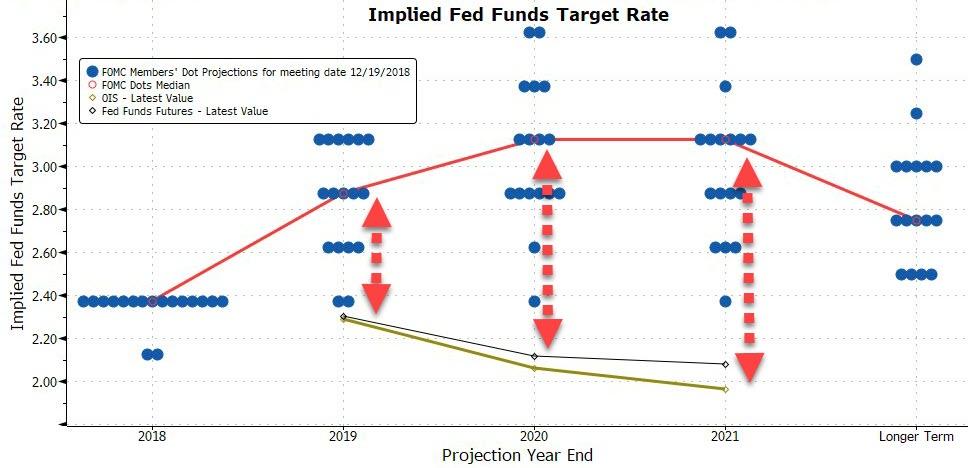
And just to
make sure the humiliation is complete, keep in mind that the market now expects
1 rate cut in 2020 (whether that happens is a different
matter as discussed earlier), so there is the
distinct chance that the Fed's capitulation may be even worse if, in order to
give the market comfort, Powell & Co. somehow manage to hint at a rate cut
in the coming year.
See Chart:
How will
the market react, and whether all this dovishness (and
more) has already been priced in, will be revealed at 2pm on Wednesday.
….
----
----
About That Impending 'US Demographic Tailwind'
Narrative
According to a recent Morgan Stanley report,
linked HERE, the Millennials and Gen Z are about to
provide a positive "youth
jolt" to power the US economy higher, and "provide a rosier outlook for Social
Security and Medicare".
In Morgan
Stanley's own words;
"For
the U.S. economy, the demographic tailwinds created by these high-population
cohorts could be significant, delivering the kind of “youth jolt” that the Baby
Boomers were famous for. However, according to a recent report from Morgan
Stanley Research, the implications of these demographic shifts aren’t baked
into current Congressional Budget Office forecasts, in particular, the
projections for labor-force growth".
"Work by
the firm’s economic team, along with an in-depth survey of Generation Y and Z
consumers, uncovered a significantly brighter outlook for the U.S. in the
coming decades than previously thought. As Gens Y and Z combine in the
workforce, these two outsized generations could power higher consumption, wages
and housing demand, all pillars of GDP growth".
"In
addition, these new projections on labor-force growth could also mean a rosier
outlook for Social Security and Medicare solvency, offering investors an
overall bullish view for the U.S. between the 2020s and 2040s—and policymakers
a different perspective on the road ahead."
Before
reading my rebuttal, I really encourage readers to read through Morgan
Stanley's Research.
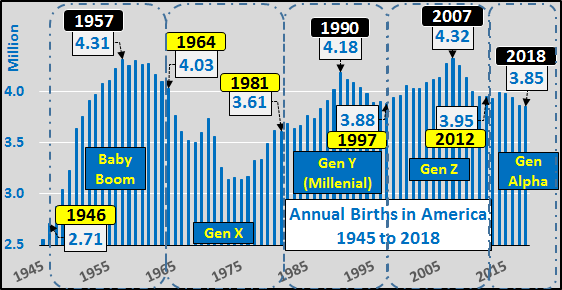
First,
I really struggle with the whole generational labels
as they represent uneven and ill-defined time periods. The chart below
shows annual US births since 1945 plus generation callouts. Meh?!?
See
Chart:
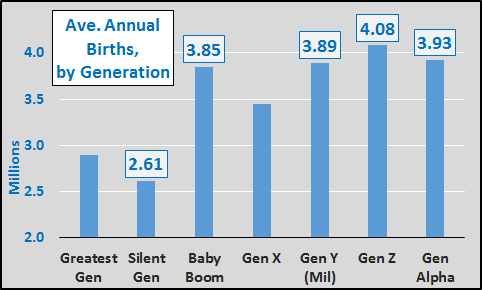
So, to put
some sense to the generations, I simply summed the total births during
each and divided them by the duration of each generation. Couple of
big noteworthy points:
- The Baby Boom represented a massive average increase of 1.6 million births annually over that of the previous Silent generation or a 66% uptick
- Gen Y (Millennials) average annual births increased less than 42 thousand annually over the Baby Boom, a 1.1% increase
- Gen Z average annual births were 230 thousand more than the Baby Boom, a 6% increase
- Gen Alpha (now 6 years underway) average annual births have declined by 155 thousand (-4%) compared to Gen Z
Due to
tanking fertility rates, a significantly larger total population (inclusive of
rising numbers of legal/illegal immigrants) has essentially had no more
children than during the Baby Boom.
See Chart:
The
chart below highlights the average earning, spending, and labor force
participation differentials of the demographic segments. On average,
75+ year olds earn and spend half of what the peak age groups do...and have
just an 8% labor force participation rate compared to the 80% of the peak age
groups.
See Chart:
Annual Household
Income-Expenditure Labor
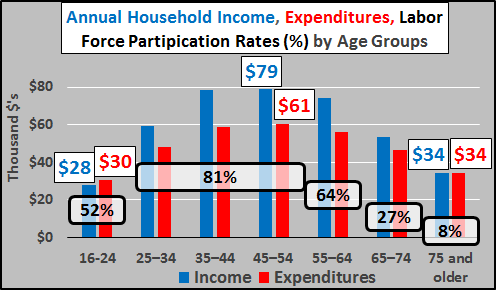
I
mention this because the 75+ year old population will be the driver of US
population growth for decades, as the chart below details.
See Chart:
American
Elderly by Age Segment
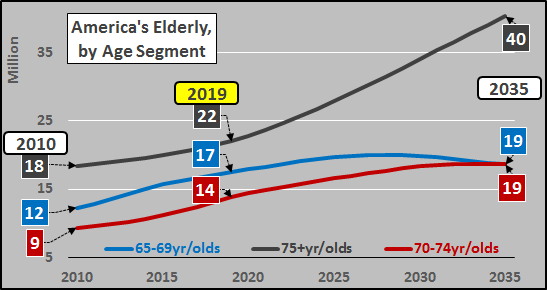
Concluding Thoughts:
Given
mortgage rates still have little room to move lower, the mismatch of
elderly potential sellers versus younger potential buyers, and the student loan
hindered young adults choosing to delay marriage and have significantly fewer
children...I'm of a mind housing (anywhere near current prices) is oversupplied
and a variant of 2008's housing crisis is more likely than not. The US
economy is not about to be positively "jolted". But then again,
I'm just a blogger with no research team, nothing to sell, and no book to
talk. This is America, so when in doubt, just pick the source with the
happy story that suits you best.
….
----
----
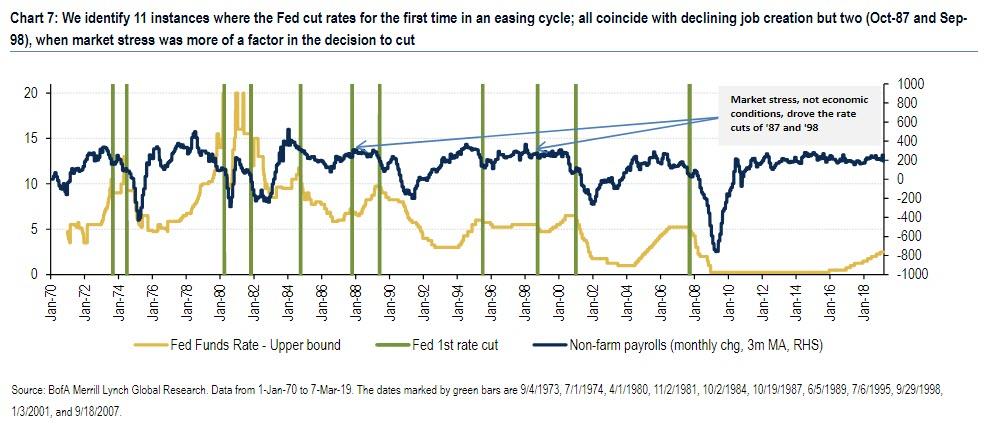
Today's low levels of recent
S&P realized volatility (30-day is around 10 vol points) appear
inconsistent with a rate-cutting environment, given that in only one instance
out of 11 historically was realized volatility lower than it is today
See Chart:
Assuming
that is indeed the case, what does
history tell us about the behavior of equity vol in the lead-up to a cut"
To answer
this question, BofA looked at all major first cuts in Fed Funds since 1972.
While changes in short-term rates serve as a good barometer of monetary policy,
the means used by the Fed to pursue its mandate have varied over the years. For
example, between 1979 and 1982, under Volcker's leadership, the Fed used money
supply as the main tool to tame inflation, letting short-term rates fluctuate
more freely than in other periods. For those instances, BofA relied on
historical archives to pinpoint dates of important changes in Fed policy. The chart below shows the resulting dates, which the bank
used in its analysis of the relationship between Fed rate cuts and US equity
vol.
See Chart:
https://www.zerohedge.com/s3/files/inline-images/first%20rate%20cut%20in%20history.jpg?itok=HdIHey_e
While
aggregate summary stats point to higher vol as we move towards a potential rate
cut, it is also worth considering
whether one of the periods where vol fell would be a relevant analogue to
today. Realized vol fell in the 6 months leading up to the cuts of
Jul-74, Jun-89, and Jul-95, while it barely rose in Jan-01. However, according
to BofA these periods in which vol fell are not appropriate analogues for
today, as:
- In 1974, this decrease in vol happened towards the end of an 18-month, 48% drawdown, where vol reached local highs prior to the Fed intervening. While we saw some market weakness in Q4-18, it doesn't compare to the depth of that selloff.
- In 1989, vol was still on the way down following the '87 crash, also not comparable to today's vol rising from record lows in 2017.
- In 1995, the Fed began a mild easing cycle seemingly in response to slowing growth and significant volatility in bond markets. Equity markets showed little concern leading up to the cut and, in fact, rose 50% in the 18 subsequent months, far from most people's outlook for markets today.
- In Jan-01, the episode when vol rose the least in the preceding 6 months, realized vol was already in the mid-20s following the pop of the Tech bubble, limiting its response higher to the cut in rates.
Finally,
looking at what the Fed Funds futures market was implying ahead of "first
cuts" in interest rates since 1989, it seems that in most cases the rates market was in fact
pricing in varying degrees of a hike, and was hence "surprised" by
the cut. Even though this didn't lead to a consistent response
from volatility across episodes, one may still wonder whether a potential rise in volatility is less
likely if markets accurately price the cut well in advance (as they may be
doing today). and by extension, whether such market discounting may prevent the
very event that is supposedly being priced in (i.e., not rate hikes until
stocks slide again and vol surges).
As BofA
concludes, while history doesn't help us establish much precedent here, today's low levels of recent
S&P realized volatility (30-day is around 10 vol points) appear
inconsistent with a rate-cutting environment, given
that in only one instance out of 11 historically was realized volatility lower
than it is today. All else equals, this suggests that all those who are
convinced the Fed's next act will be a rate cut in approximately 9 months may
be in for a rude awakening.
…
----
----
Is the winter of Europe's discontent coming to an end?
See Chart:
The
European Economy tends to follow China
See More
charts at:
…
SOURCE: https://www.zerohedge.com/news/2019-03-17/spring-coming-why-europe-looks-set-surprise-upside
----
----
US DOMESTIC POLITICS
Seudo
democ duopolico in US is obsolete; it’s full of frauds & corruption. Urge
cambio
Trump is hopping mad the EU for at least seven reasons. Mad enough to foolishly smack them with
tariffs? I Believe so.
----
----
It’s
just another name for an old, and very
stupid, set of economic ideas... MMT is about radically increased government control.
Now, this concept isn’t new. It’s been around for
decades. But its popularity has skyrocketed, thanks to endorsements from
Democratic presidential candidate Bernie Sanders and Congresswoman Alexandria
Ocasio-Cortez (AOC), the new rising star of the Democratic Party.
The left ? has a new obsession: Modern Monetary
Theory (MMT).
MMT is an economic theory which essentially argues
that the U.S. government wouldn’t need to collect taxes or borrow money to
finance spending. It could simply print more money if necessary.
….
[[ This view on MMT doesn’t fit with Keynesian
Economics where spending drives Econ growth and much less with Austrian
Economics (Mises Inst) where savings and
production (not mere speculation) drives
Economic growth. This MMT “theory”
doesn’t fit with the lines of most notorious
schools of Economics of our time (Keynes and Misses ) and much less with socialism.
That is because they still in the time of Smyth & neoclassical that believe
the market can cure itself its imperfections
without any intervention from the State-Gvt. The fact is that the 1930 crisis put
that theory in the trash bag. They couldn’t prevent the great depression and not even offered a solution to the
problem. I was Keynes
in his “General Theory of employment ,
Interest and Money” who offered a
solution to full employment and regular
growth. Since then the private sector (BIG
Corp) has to be monitor and regulated by Central Banks & Govt. The republican Eisenhower, Nixon, Ford and Regan failed, they did not get the GDP growth
expected, and the pro Keynesians FDR, Truman, Kennedy and Carter succeeded. .
“The left ?? has a new obsession for Modern Monetary Theory (MMT)”. That is false.
“MMT is an
economic theory which essentially argues that the U.S. government wouldn’t need
to collect taxes or borrow money to finance spending. It could simply print
more money if necessary”. It is what Trump is doing it.
The
socialists instead are in favor of regulation but in the interest of the labor
or workers. That is the difference. To classical Keynesians: whatever State expending generates growth
& they consider 4 factors: 1- Consumer spending (distorted by Corp propag).
2- Govt expending (in weapons & wars) 3- Business investment (based on
speculacion and Wall Street artificial
booms & burst) and 4- Net exports
(now we have a deficit with the USD at the point of collapse). All Economy depends on who is in power and in
whose interest it works. AOC and other socialists are
very clear on this point.
[[ In short This article depart from false premises: and arrive to false conclusion. Does AOC HAS SUSTAIN & DEFEND
MMT? Not that I know. WHERE? .. Then, this start with a grossness lie to finish with
insults to AOC, that is not way to debate decently. Are the debaters in
this art notorious Economists? NOT, that
I know. Then their insults came back to both comedians like a boomerang on
their head. ]]
----
----
Around 20% of Americans have a medical claim on their credit
report...
===
US-WORLD ISSUES (Geo Econ, Geo Pol & global Wars)
Global
depression is on…China, RU, Iran search for State socialis+K-, D rest in limbo
Missile launch plans were being relayed as the crisis
unfolded.
….
[[ What stupid
conflict: their enemy is not there.. It is here, in the US ]]
----
----
The meeting between US
President Donald Trump and Chinese counterpart Xi Jinping to end the trade war
which was tentatively pushed back from March to April, may be pushed back
again, this time to to June, the SCMP reported.
----
[[ Intentional or not.. this delay contribute to the fall of Trump ]]
====
SPUTNIK
and RT SHOWS
GEO-POL n
GEO-ECO ..Focus on neoliberal expansion
via wars & danger of WW3
They want WW3, if RU-China would’ve wanted too.. they will hit now
----
----
Election with duopoly system will
reproduce chaos.. no point in more circus
----
----
----
----
----
----
----
----
----
----
----
----
----
RT SHOWS
----
----
----
----
----
NOTICIAS
IN SPANISH
Lat Am
search f alternatives to neo-fascist regimes & terrorist imperial chaos
VIENTO SUR
Hezbolá Fundamentalismo religioso vs neoliberalismo Joseph Daher
----
----
RT EN ESPAÑOL
- Maduro pide renuncia a todo su gabinete de ministros para una "reestructuración profunda"
- The NYT revela que prácticas para pilotar los Boeing 737 MAX se hacían con un iPad
- Reporte: India y Pakistán amenazaron con atacarse mutuamente con misiles
- Advierten al US de graves consecuencias si aprueban ley que permita demandar a la OPEP
- Especial
del Califato Filipino: Testimonios de menores reclutados
por el EI: "Nunca olvidaré cómo maté a un cristiano"
----
----
GLOBAL
RESEARCH
Geopolitics
& Econ-Pol crisis that leads to more business-wars from US-NATO allies
-It
Started in Daraa on March 17, 2011: The US-NATO-Israel Sponsored Al Qaeda
Insurgency in Syria. By Prof Michel
Chossudovsky,
-
Fukushima
at Eight: Ongoing Cover-Up of the Nuclear Hazards in Japan and Abroad
By Michael Welch,
Dr. Helen
Caldicott
- Veterans
Call on U.S. Troops to Resist Illegal Orders to Invade Venezuela in Response to
Trump By Veterans for Peace
----
----
PRESS
TV
Resume of
Global News described by Iranian observers..
Programs The Debate
Ryach atrocities in Yemen
----
===
No hay comentarios:
Publicar un comentario