ND
FEB 16 SIT EC y POL
ND denounce Global-neoliberal debacle y propone State-Social
+ Capit-compet in Eco
- A MOST
CONVENIENT VIRUS By Dmitry Orlov This virus was
genetically engineered in one of the Pentagon’s biological weapons laboratories
and introduced into China
====
ZERO HEDGE ECONOMICS
Neoliberal globalization is over.
Financiers know it, they documented with graphics
It's
"the other 1%" vs everyone else as scorching mega-cap earnings
strength from the FAAMG contrasts with small-cap earnings weakness.
The main reason why companies are beating is Trump himself:
i.e., a much lower
effective tax rate than expected (17% vs. 20%) aided in company margin beats, even as
overall margins contracted in every sector in the S&P 500 and declined in
aggregate for the fourth consecutive quarter.
Which brings us to the most fascinating aspect of Q4
earnings season, namely
the impact of what Morgan Stanley previously called "The
other 1 percent":the outsized influence of
the five biggest companies in the S&P.
As Goldman notes, results were disparate across the size
spectrum, with the 5
largest stocks (FB, AMZN, AAPL, MSFT, GOOGL) disproportionately boosting
aggregate S&P 500 results in 4Q. As
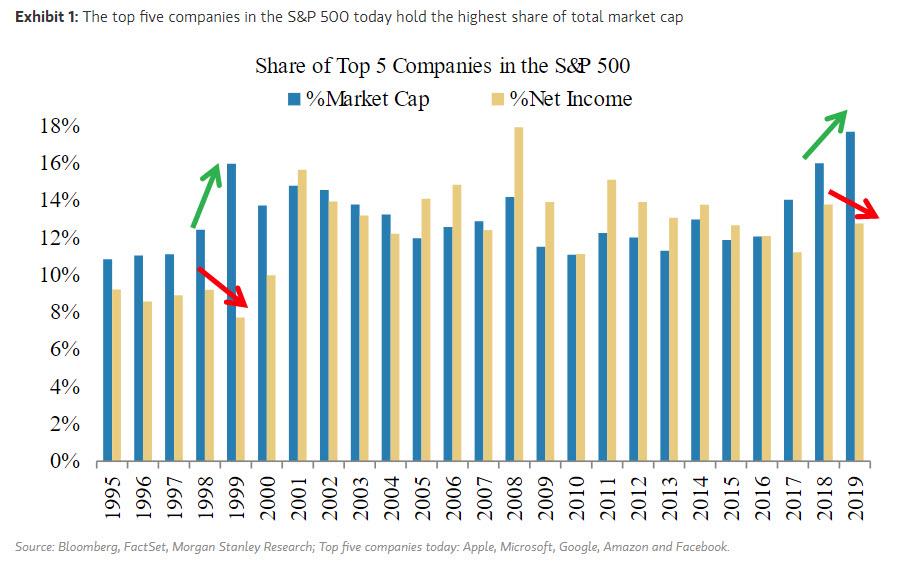
Morgan Stanley first noted a month ago, FAAMG account for 18% of S&P 500
market cap and 14% of S&P 500 earnings.
See Chart:
Share of 5 Top Companies in the S&P 500
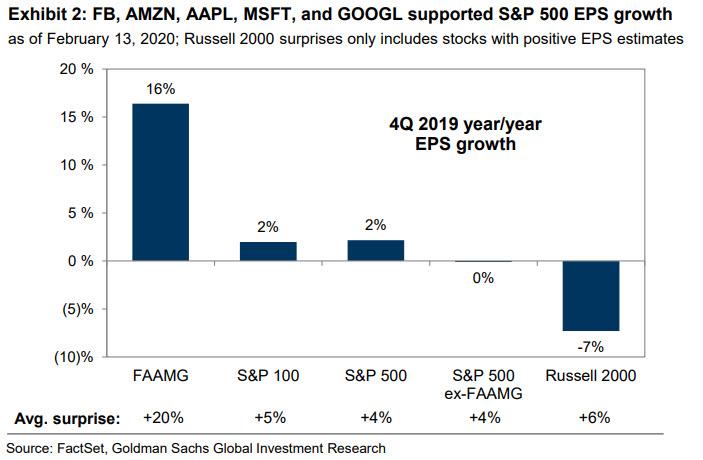
During the fourth quarter, these 5 stocks posted an average
earnings surprise of +20%, compared with just 4% for the average S&P 500
company. And the most striking conclusion from earnings season: the "other
1%", i.e., FAAMG, grew EPS by
16%, compared with 0% for the S&P 500 excluding these five stocks, or as Goldman puts it, "mega-cap earnings strength contrasts
with small-cap earnings weakness."
See Chart:
FB, AMZN, AAPL, MSFT and GOOGL
supported S&P500 EPS Growth
WHO are d beneficiaries of Trump’
Economics?
As shown in the chart above, while the 5 biggest companies are just getting
bigger as they stretch their monopolistic wings, scorching EPS growth of 16%
Y/Y, the rest of the market is suffering, and the Russell 2000 experienced a
whopping 7% earnings drop during the fourth quarter, as many smaller firms posted weak top-line growth and had
difficulty absorbing rising wages and other input costs. The Russell 2000
has lagged the S&P 500 by 175 bp since the start of earnings season (+1%
vs. +3%).
Continue reading & see more
charts at:
----
----
The end of
the cycle is coming.
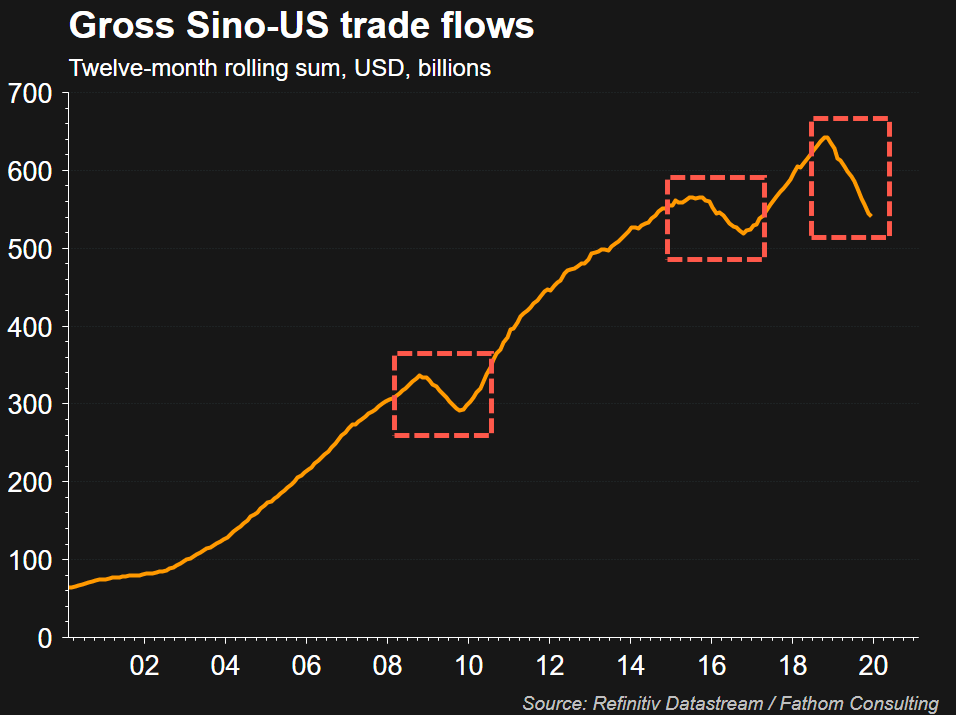
China and the US have enjoyed two decades of increasing
trade flows that have jumped from $61 billion a year in 2000 to $540 billion in
2019. But the ugly
end of globalization is starting to be
realized, as trade flows have plunged from Nov 2018 of $635 billion to $540
billion in Dec 2019, or about a 15% drop.
See Chart 1:
Gross Sino-US trade flows
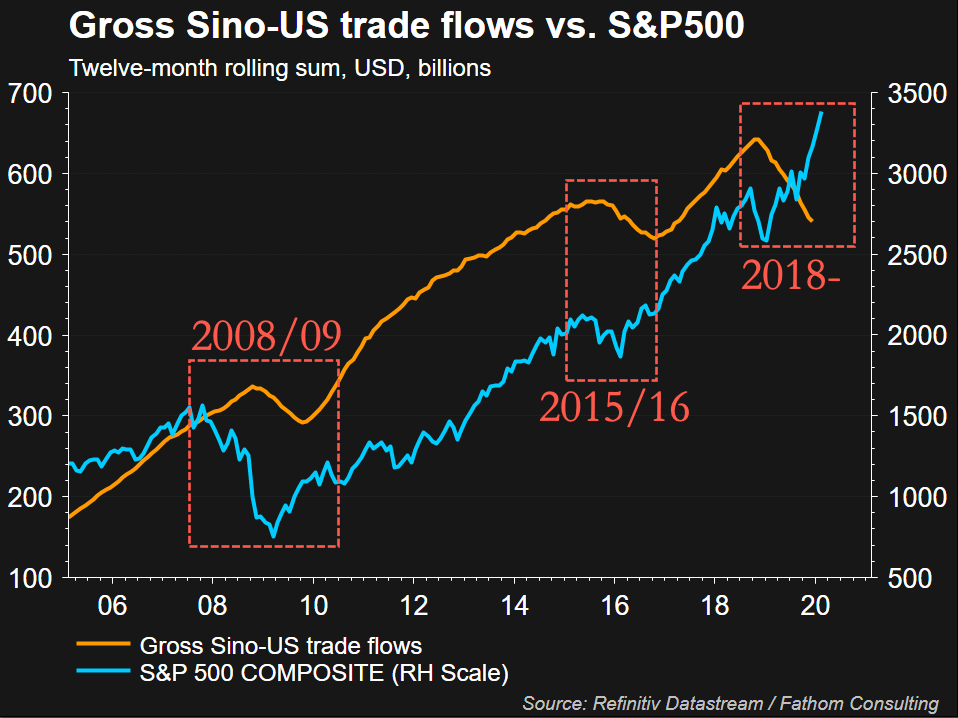
The IMF, WEF, and UN have already warned that the global
economy will continue to decelerate due to the
trade war – now it appears the virus shock will send the world deeper into
de-globalization that could lead to a financial crisis.
See Chart:
Gross Sino-US trade flows vs.
S&P 00
….
SOURCE: https://www.zerohedge.com/markets/sino-us-trade-flows-reveal-next-market-crash-could-be-nearing
----
----
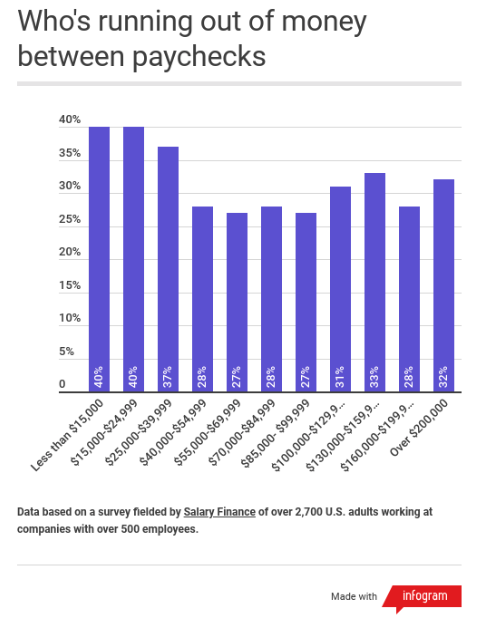
This will get worse when
the next recession strikes...
Amy is one of those Americans who are all too familiar with
her household running short on cash as her husband makes about $50,000 per
year.
And which
responders are running out of money in between paychecks?
Well, it's widespread according to the data – at least a third on average across all salary ranges.
See Chart:
Who’s running out of money between
paychecks?
See more charts & comments at:
….
----
----
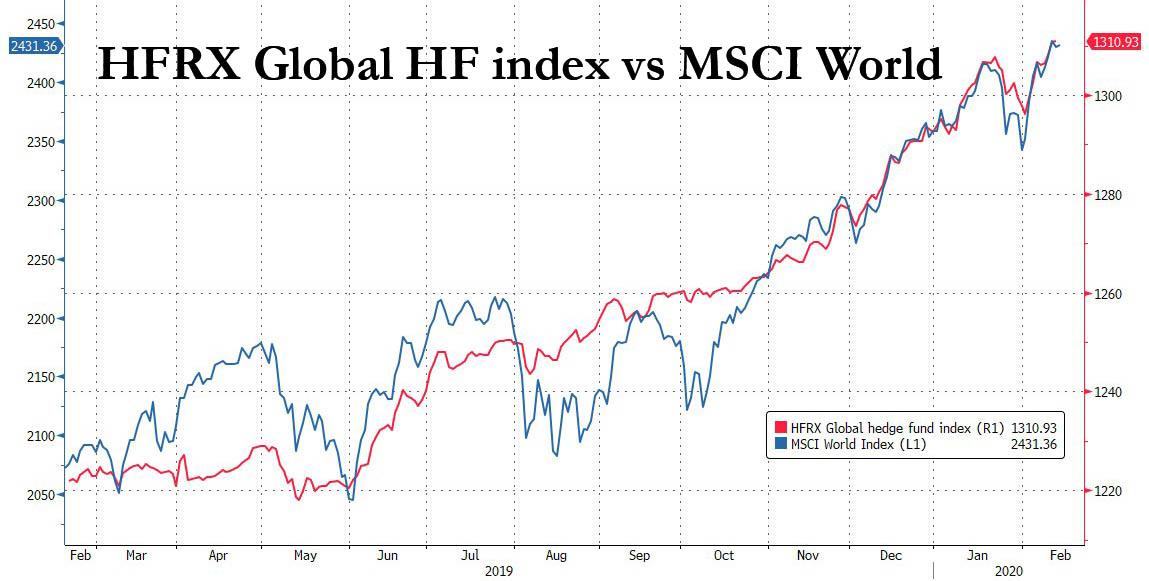
In a rising market, investors
typically find themselves shorter than desired, but once a correction arises,
investors quickly find themselves much longer than desired exposing market
vulnerabilities.
See Chart:
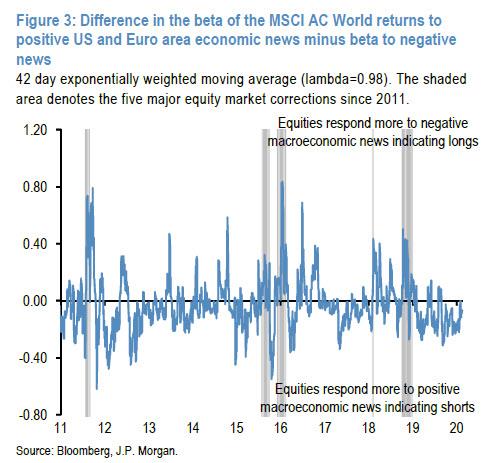
What is notable here, is that when the MSCI AC World index is more responsive to positive economic news
and less responsive to negative news, this would point
to an overhang of short equity positions and vice versa.
See Chart:
Bond Yiels respond more to negative
macroeconomic news indicating Shorts
See Chart:
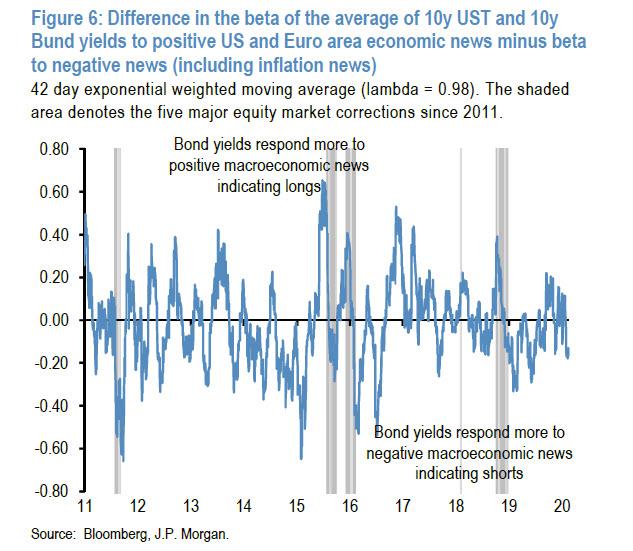
Therefore the
fact that these indicators have been mostly negative this year does not
necessarily reflect investor positioning. In
fact, for equitiesthe bank's position
indicator look rather elevated especially among CTAs and Equity Long/Short
hedge funds. As such, the way to read these indicators is
that in a rising market,
investors typically find themselves shorter than desired, but once a correction
arises, investors quickly find themselves much longer than desired exposing
market vulnerabilities.
….
----
----
One of the most alarming aspects of this
buyback bonanza is that companies are repurchasing shares at a fever
pitchwhile insiders are dumping their shares at an equally feverish
rate...
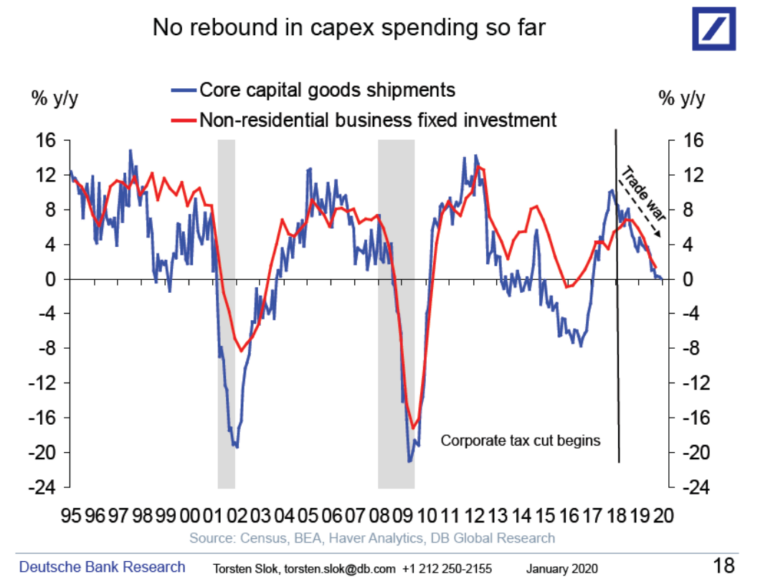
In the US, senior
management teams have been pikers when it comes to what is typically referred to as “cap ex”. This is despite 2018’s monster corporate tax cut which was supposed
to accelerate capital expenditures. In reality, their long downtrend has
continued but what has truly exploded is the rate of share repurchases, aka,
buybacks.
See Chart:
No rebound
in cap-ex spending so far
EXPLANATION: Summary
- The main international benchmark excluding the US has essentially flat-lined for 14 years, while the S&P has continued to set new records since 2009.
- China, which has been one of the most important developing countries for the last thirty years, outpaced the United States in terms of economic growth; however, its stock market has continued to lag.
- This has been the same story for emerging markets as a whole; superior economic growth with much lower stock market returns.
- A prime reason for this outcome is that faster growing countries need capital to fuel their expansions with a combination of debt and equity issuance.
- As such, fast economic growth requires large quantities of equity offerings, which often dilutes existing shareholders.
- In the US, senior management teams haven’t accelerated capital expenditures.
- Instead, what has truly exploded is the rate of share repurchases, aka, buybacks.
- In 2018 alone companies paid out a combined $1.25 trillion in dividends and buybacks.
- The dark side of this is that net debt to cash flow is at a 16-year high, as dividend and buybacks have been running above excess cash flow since 2013.
- To elevate debt to dangerous levels to enable share repurchases is the antithesis of judicious corporate stewardship.
- This is almost certainly destroying long-term value for shareholders (though this won’t be obvious for years to the market overall).
- Due to the Fed’s four QEs, the 2018 corporate tax cuts, and trillion-dollar federal deficits, this day of reckoning has been postponed.
- One of the most alarming aspects of this buyback bonanza is thatcompanies are repurchasing shares at a fever pitch while insiders are dumping their shares at an equally feverish rate.
- This hypocritical behavior has become a target of both political parties; this likely poses an immediate threat to the continuation of buybacks at any (long-term) cost.
BYE-BYE
BUYBACKS?
Continue reading at
….
----
----
US
DOMESTIC POLITICS
Seudo democ duopolico in US is obsolete; it’s full of frauds
& corruption. Urge cambio
Much of Sander's appeal comes from his promises he can
deliver a more just society... exposing a glaring weakness in the democratic system, and that is, ahighly motivated minority can overwhelm an
unmotivated majority...
====
US-WORLD ISSUES (Geo Econ, Geo Pol & global Wars)
Global depression is on…China, RU, Iran search for State
socialis+K-, D rest in limbo
China Adopts 'Cultural
Revolution-Style' Social Controls To Crush Outbreak As Death Toll Nears 2,000
"Can’t
get off here fast enough..."
====
"We
will support qualified firms so that they can resume work and production as
soon as possible, helping maintain stable operations of the economy and
minimizing the epidemic's impact."
====
Which is
good news - the closer we get to a depression, the closer we are to the moment
when central bankers will literally buy everything.
See Chart:
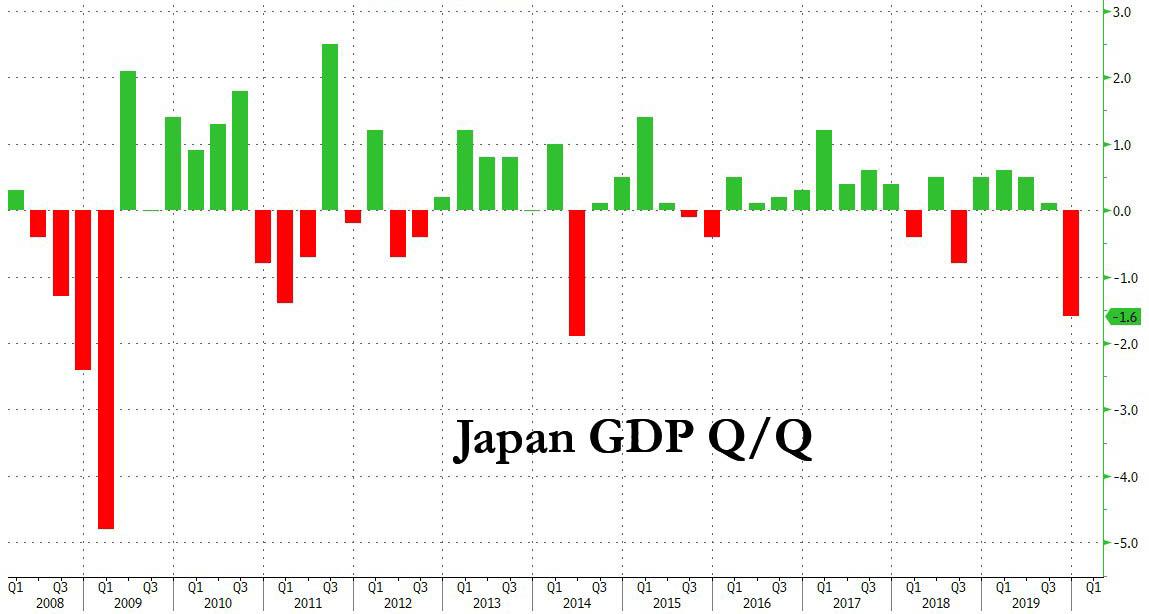
One look at the GDP components confirms that the plunge was
largely the result of collapsing consumption, with Houshehold Consumption plunging at an 11.5% annualized pace, the second
biggest drop that Private Demand plummeted at an -11.1% annualized basis...
See Chart:
Japan Real GDP Anualized Consumption
of Households
….
SOURCE: https://www.zerohedge.com/economics/japan-unexpectedly-reports-terrible-gdp-it-slides-recession
====
"We
will preserve the Peace!"
====
SPUTNIK and RT SHOWS
GEO-POL n GEO-ECO
..Focus on neoliberal expansion via wars & danger of WW3
----
----
NOTICIAS IN SPANISH
Lat Am search f alternatives to neo-fascist regimes &
terrorist imperial chaos
RT EN ESPANIOL
Evo Morales: "En tres meses el gob de facto de
Áñez ha destruido todo lo que hemos construido con el pueblo" https://actualidad.rt.com/actualidad/343235-morales-acusar-gobierno-anez-destruir-meses-todo-construido
López Obrador: "'Don Dinero' ya no va a decidir
sobre la vida pública de México" https://actualidad.rt.com/actualidad/343247-lopez-obrador-don-dinero-no-decidir-vida-publica-mexico
Guaidó regresa a Venezuela tras su gira
internacional y se enfrenta a un escándalo de corrupción https://actualidad.rt.com/video/343244-guaido-regresar-venezuela-gira-internacional
Las fuerzas sirias toman el control de los
alrededores de la ciudad de Alepo https://actualidad.rt.com/video/343240-fuerzas-sirias-toman-control-alrededores-alepo
Tribunal Supremo Elect de Bolivia definirá la próx
semana si autoriza la candidatura de Evo Morales https://actualidad.rt.com/video/343226-tribunal-supremo-electoral-bolivia-definir-candidatura-evo-morales
----
----
COUNTER PUNCH
Analysis on US Politics & Geopolitics
-Andrew Levine Mayor
Mike, Worse Than Mayor Pete
-Russell Mokhiber NPR
and the Escalating Attack on Single-Payer Health Care
-Peter Certo Who’s
Afraid of Socialism?
----
----
ASIAN NEWS
Press TV
The Debate on Trump’s power
----
===
No hay comentarios:
Publicar un comentario