ND JUN 6 19 SIT
EC y POL
ND denounce Global-neoliberal
debacle y propone State-Social + Capit-compet in Eco
ZERO HEDGE ECONOMICS
Neoliberal globalization is
over. Financiers know it, they documented with graphics
DEFENSE:
we got into WW3 Economy: Trump’ monarchy has absolute power
US
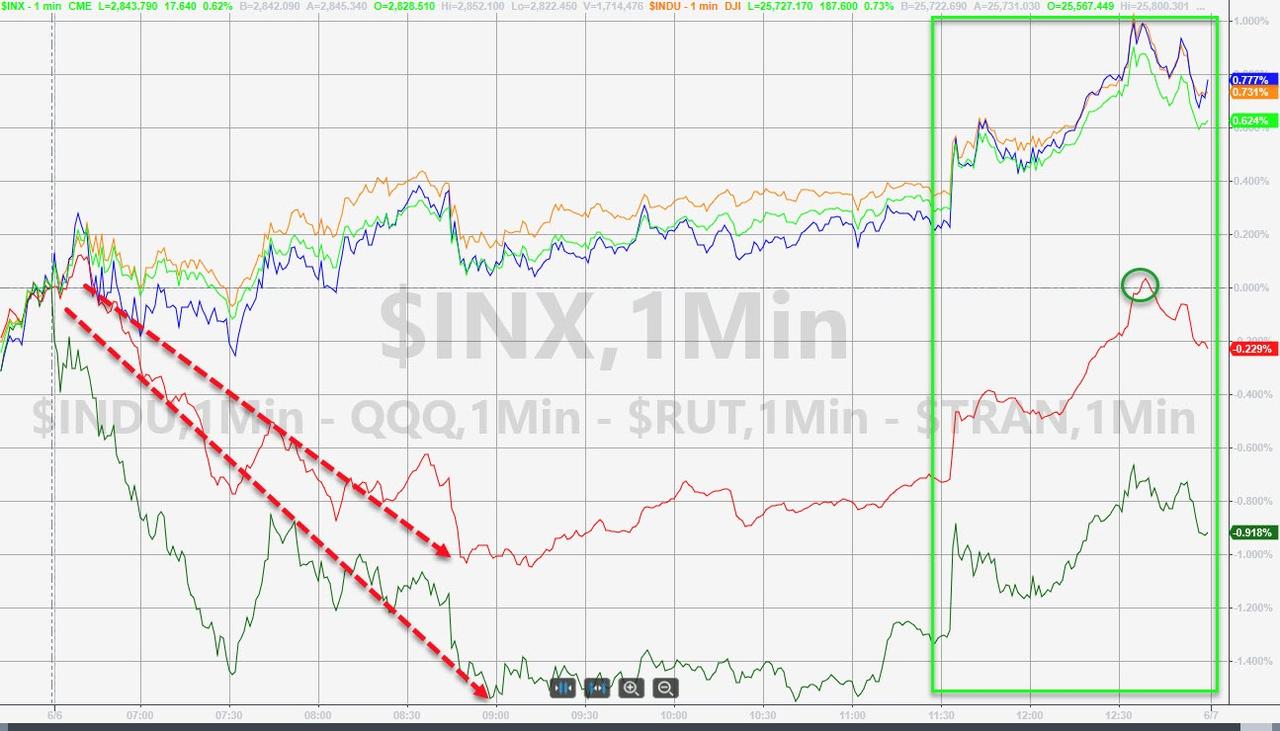
markets were mixed early on with the overnight weakness (Mexico and China)
ignored and bid into the green before the cash open. Small Caps and Trannies
(most exposed to short-squeeze) were red from the start but the rest of the
majors trod water holding modest gains (despite more Mexican tariff headlines)...
See Chart:
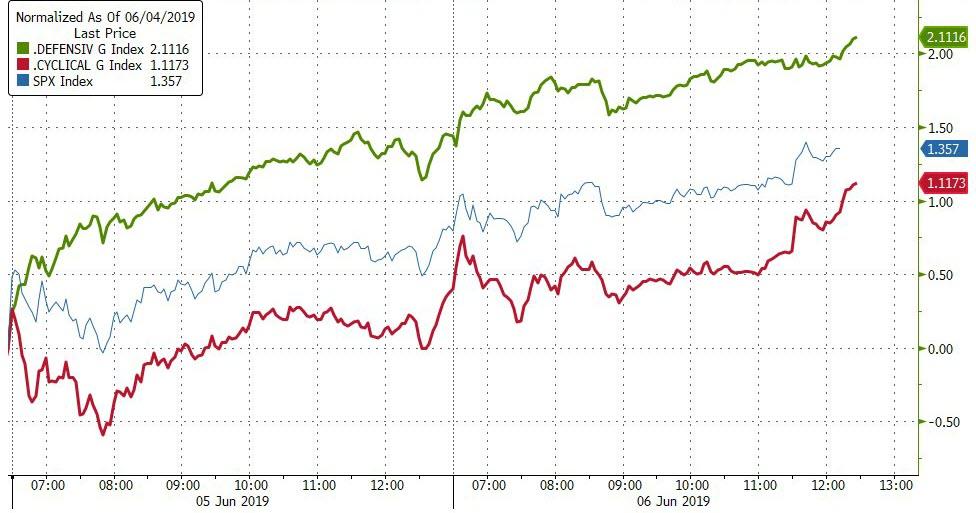
Defensive stocks are up 4 days in a row - notably
outperforming cyclicals in this ramp...
See Chart:
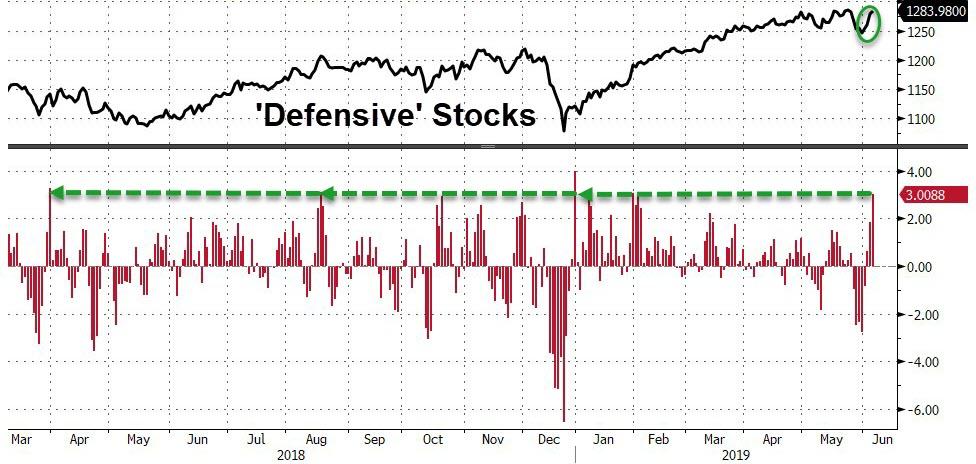
This is
the biggest 4-day surge in
defensives since Dec 31st...
See Chart:
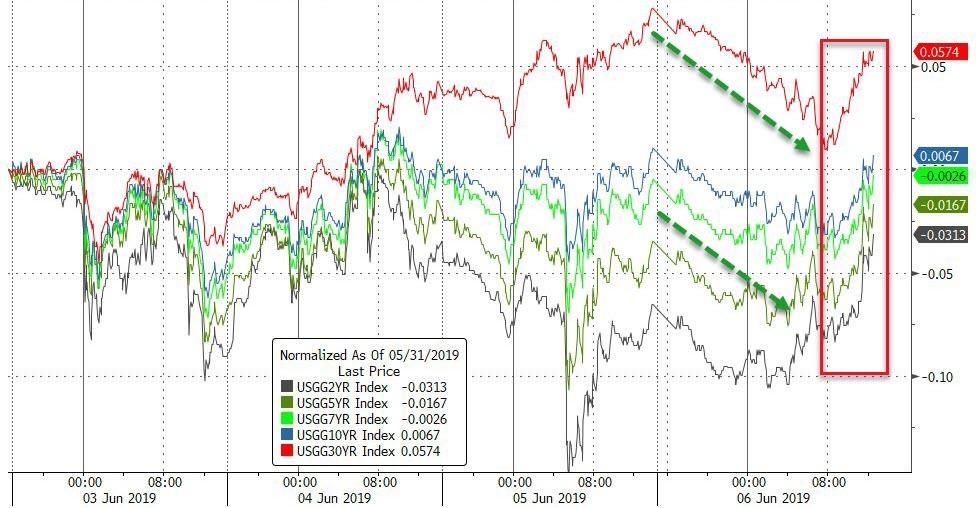
Bonds
were very mixed today with the action being the exact opposite of yesterday -
long-end outperforming notably...
See Chart:
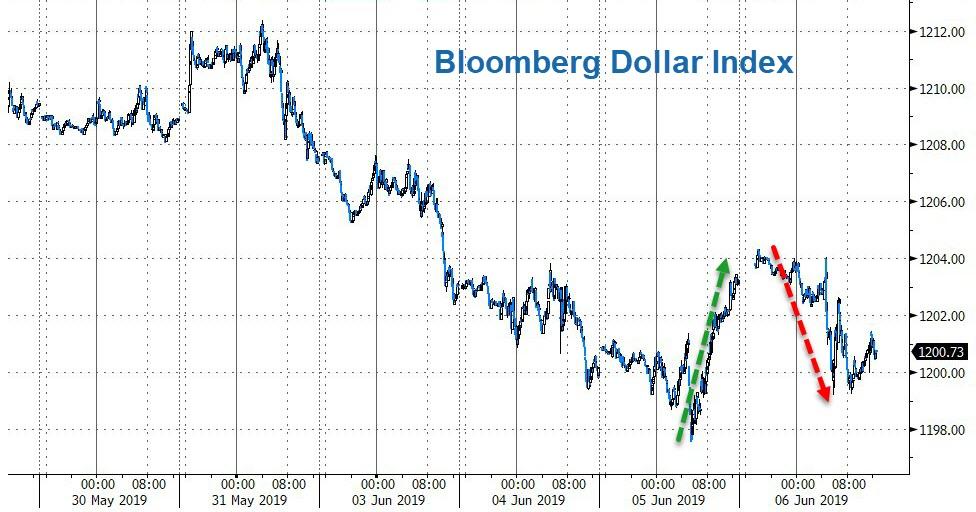
The
dollar index fell on the day, erasing yesterday's gains...
See Chart:
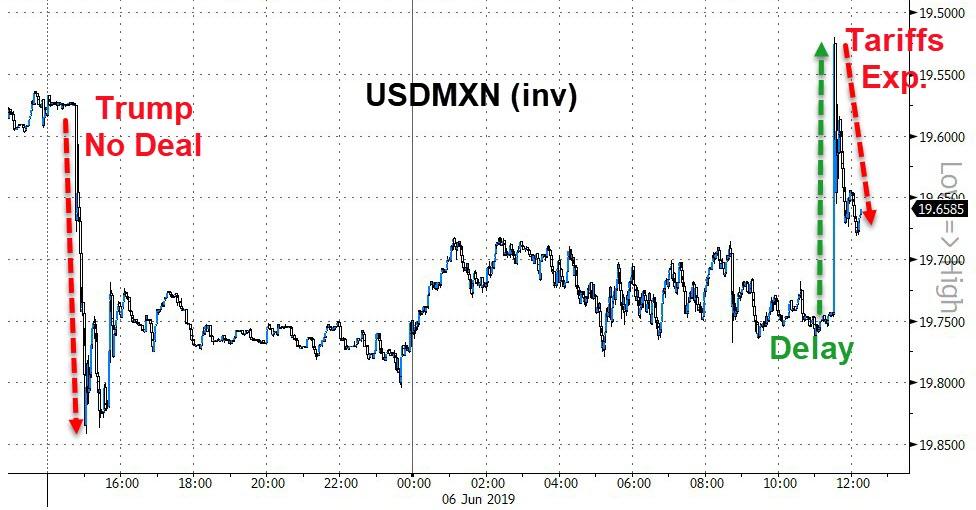
The
peso spiked on headlines about delaying the tariffs (but slid back on reports
expecting tariffs to hit)
See Chart:
NOTE -
stocks did not retrace like peso. Is this a sign of manipulation?
See chart:
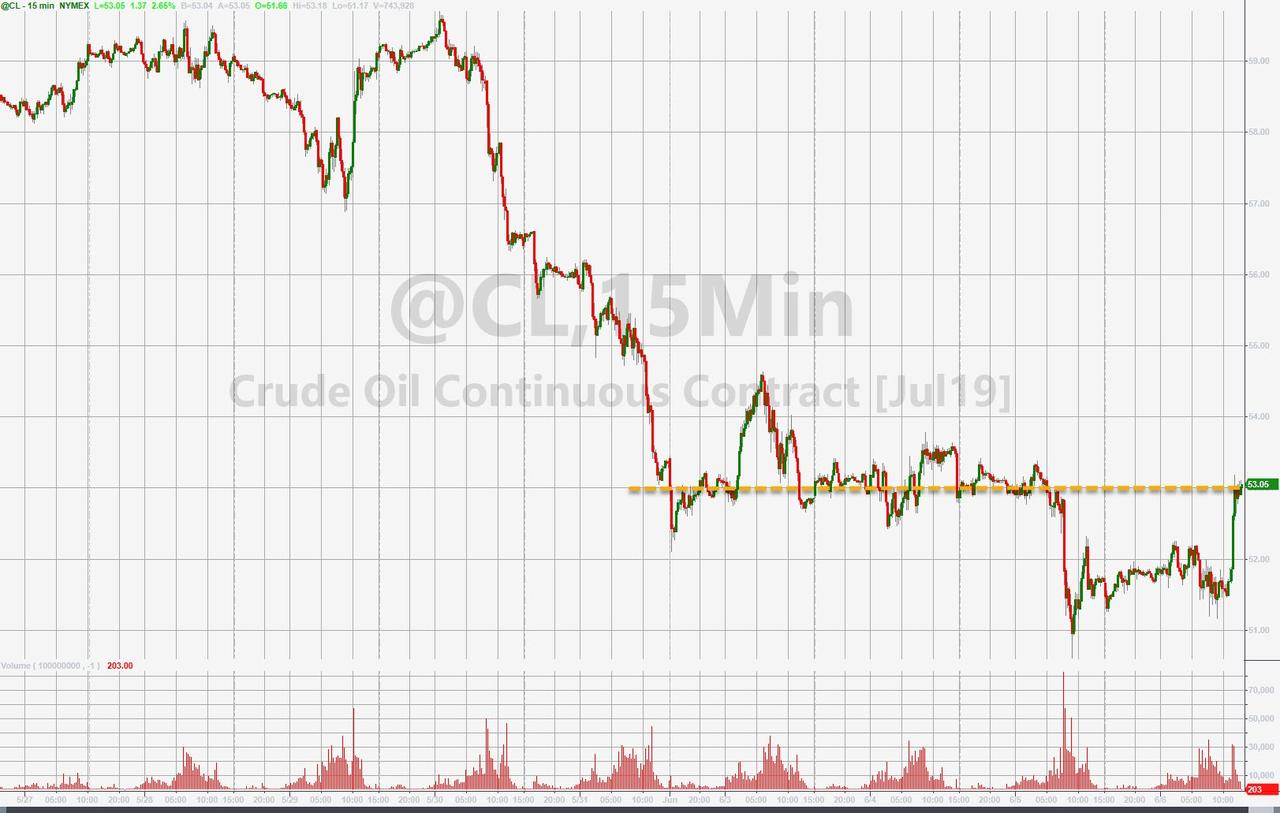
Oil
bounced on the day (after the tariff delay headlines) but some context is
worthwhile...
See Chart:
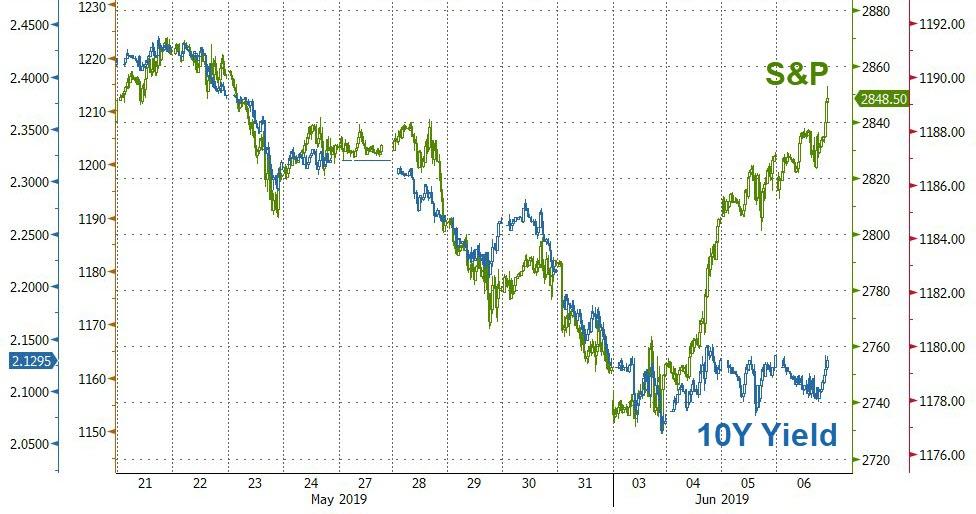
Finally,
after a string of dismal macro data, Bonds & Stocks remain drastically
decoupled...
See Chart:
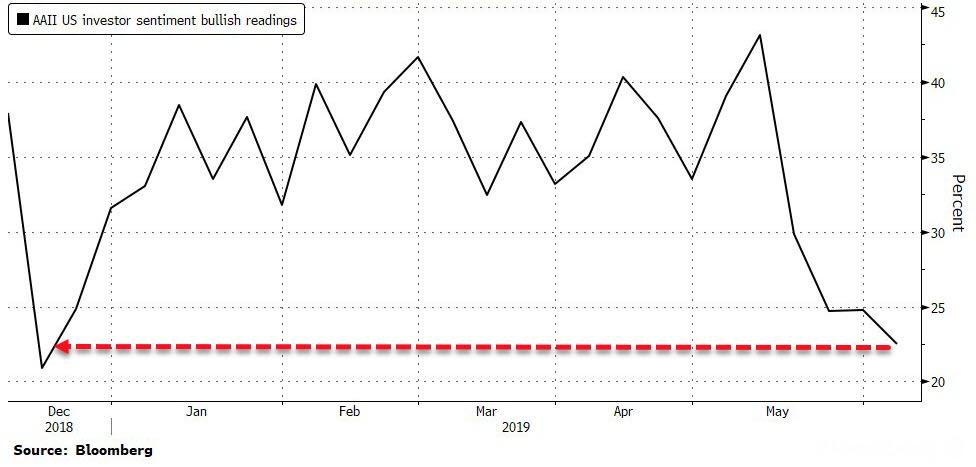
And, as
Bloomberg reports, Retail traders
are now the least bullish on the country’s equities since December, when
the S&P 500 sank to a 20-month low, according to a weekly
survey by the American Association of Individual Investors.
See Chart:
WHAT
WILL PAYROLLS SAY?
….
----
----
"The
consumer in the bottom quintile has experienced 10% more cumulative
headline inflation and 15% more core inflation, than the consumer in the
top quintile income group"
By Tyler Durden Thu, 06/06/2019
First, the background details:
Official inflation has persisted below the 2% target this cycle,
coinciding with a drift lower in inflation expectations. Throughout this year,
Fed officials have mused about "makeup strategies," allowing
inflation to overshoot the target to compensate for past undershooting. At the
Fed's June policy framework conference in Chicago, Fed
Chair Powell noted that the models suggest this strategy would be
effective, but in reality there are major credibility questions as it requires
buy-in from households and businesses. In order to become credible,
a make-up strategy would need to be communicated in advance of a downturn, and
be followed by years of consistent policy. To
BofA,Powell's comments spray cold water all over a strict inflation averaging
regime.
However, an even more important dynamic that the Fed should consider
when pushing inflation above target-inflation: gains are felt unevenly by
income cohort. Empirical observations find that when
inflation picks up, the lowest income cohort generally experiences higher
inflation than the highest income group, because they spend more income share
on rent, food at home, and other inflationary items. This can be shown by
comparing the inflation rate of the bottom 20% and the top 20% income
distribution, reweighted by their spending shares.
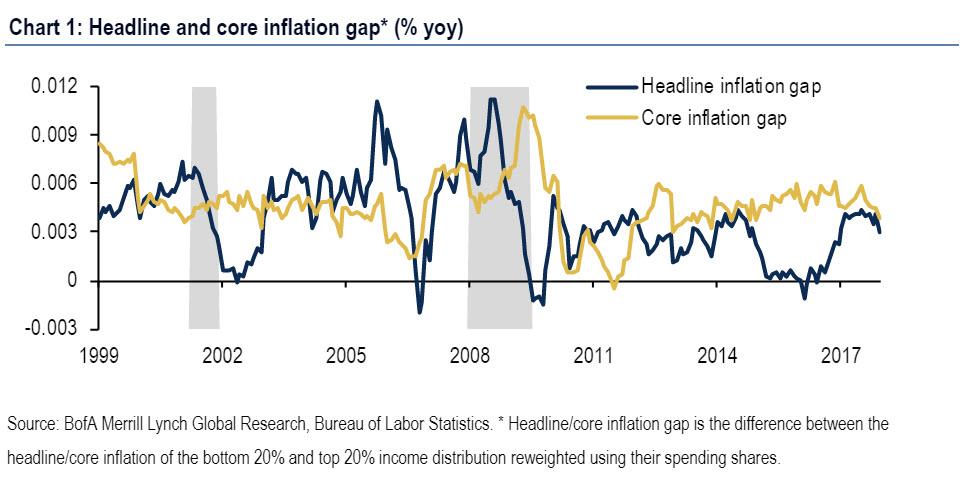
As shown below, inflation runs above for
lower income households given their spending composition.
See Chart:
Headline and “core inflation gap” (% YoY)
There is a persistently positive headline and
core-excludes food and energy-inflation gap between the bottom 20% of the
income distribution and the top 20%. Since 1999, the consumer in the
bottom quintile has experienced 10% more cumulative headline inflation (0.39%
on average) than the consumer in the top quintile income group. They have
also experienced 15% more core inflation (0.47% on average), and the core
inflation gap has been more stable compared with the headline inflation gap.
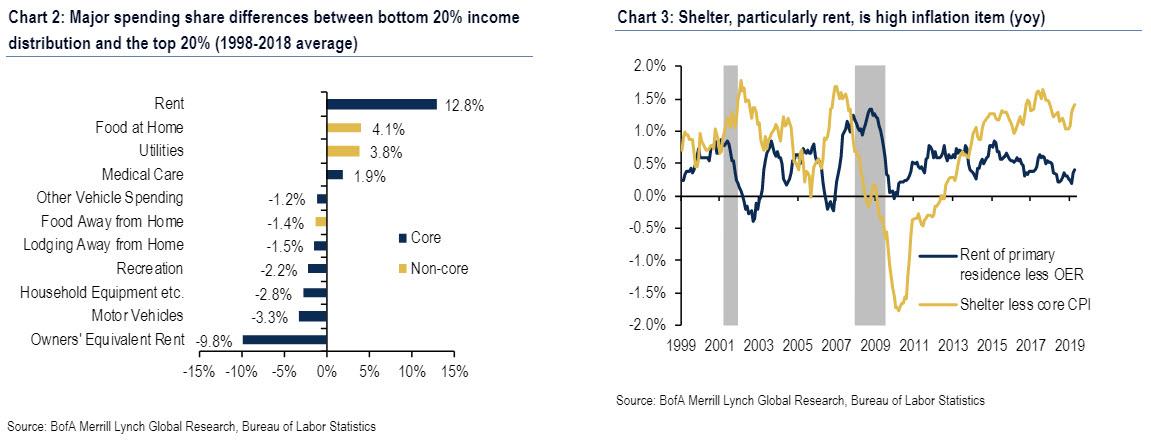
To understand these gaps, BofA compares the shopping carts of these two
groups (Chart 2). The largest difference within core lies in shelter. The lowest income consumer is much more likely to be a renter
than a homeowner, while the opposite is true for the highest income
consumer. Thus, rent of primary residence has a much larger share
in the former's spending basket, while owners' equivalent rent (OER) is bigger
in the latter. Rent of primary residence inflation
is persistently higher than OER inflation (Chart 3), thus a higher
weight in the former at the expense of latter would bias up aggregate
inflation. Also, taking into account the share differences of rent of primary
residence (+12.8%), OER (-9.8%), and lodging away from home (-1.5%) indicates
that shelter share broadly is a larger share of spending at the low-end (net
share difference around 1.5%, Chart 2 again). This
provides additional upside bias given that shelter inflation generally
runs hotter than broader core inflation, and is therefore a "high
inflation" category (Chart 3).
See Charts 2 & 3
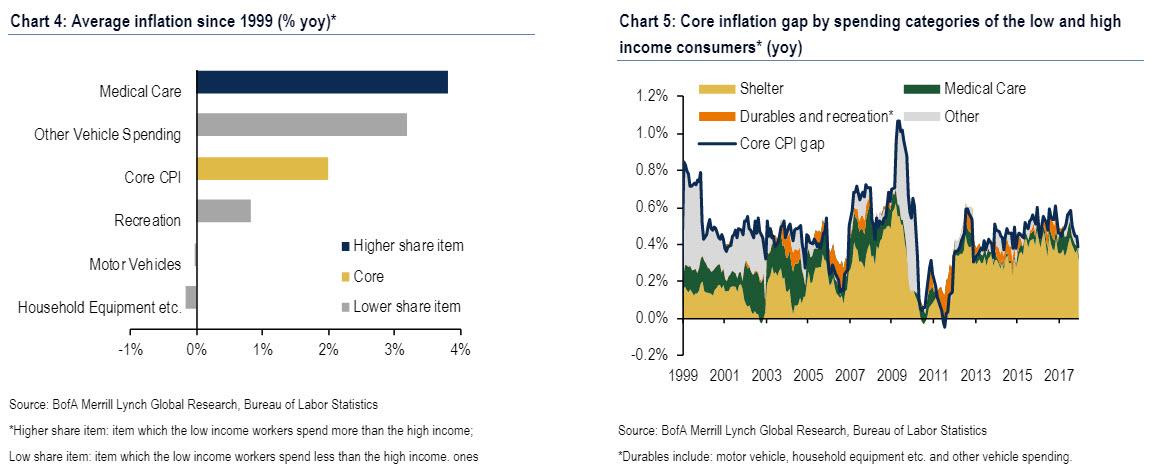
While shelter, or rather rent, is the most important spending category, there are also other categories that contribute to the core
inflation gap between the top and bottom income brackets, if on a smaller
magnitude. The lowest income consumers tend to spend more on medical
care services and less on things like motor vehicles, household equipment,
recreation, and other vehicle spending. Like shelter, medical care inflation
typically runs hotter than broader core inflation, averaging 3.8% since 1999
versus 2% for core CPI .:
With the exception of other vehicle spending, the other major core
categories where the lowest income consumer spent less than the highest income
consumer generally experienced more subdued inflation relative to core. Thus, the bottom bracket loses out relative to the top
bracket by allocating more of their spending to a high inflation category and
less of their spending to lower inflation categories.
See Charts 4 & 5
Breaking down the core inflation gap, shelter
and medical care explained 91% of the inflation gap on average from 1999-2017
(Chart 5). That said, since
the financial crisis the contribution from healthcare has declined while
shelter has picked up and now explains most of the inflation gap. The rent is, indeed, too damn high... and it is hurting
the poor first and foremost.
BofA asked rhetorically, it "the fact that
higher inflation hurts the lowest income workers disproportionally might lead
people to question if monetary policy contributes to greater inequality." Well,
of course - in fact, former Fed Chair Bernanke pointed
out in 2015 that that was one of the major critiques of
quantitative easing. Two effects are often mentioned.
- The "income composition channel": People in lower income buckets primarily rely on wages for income, while people in higher income buckets will also be compensated with corporate equities. If expansionary monetary policies boost corporate profits more than they do wages, those with claims to ownership of firms will tend to benefit disproportionately, worsening income inequality.
- The "portfolio channel": Low-income workers tend to hold relatively more currency than high-income workers. Therefore, higher inflation would hurt the purchasing power of low-income consumers more than high-income, increasing consumption inequality
In short, not only is the Fed screwing the poor... it
is doubly screwing the poor!
In other words, in the grand scheme of
things the Fed's job is to focus on those pathways that make the rich richer,
even if in the process the poor become even poorer, and the US middle class
erodes.
Bottom line, the Fed's
apologists will say, "by stabilizing the business
cycle and thereby promoting job and wage growth, the Fed produces a positive
outcome for the lowest income cohort."
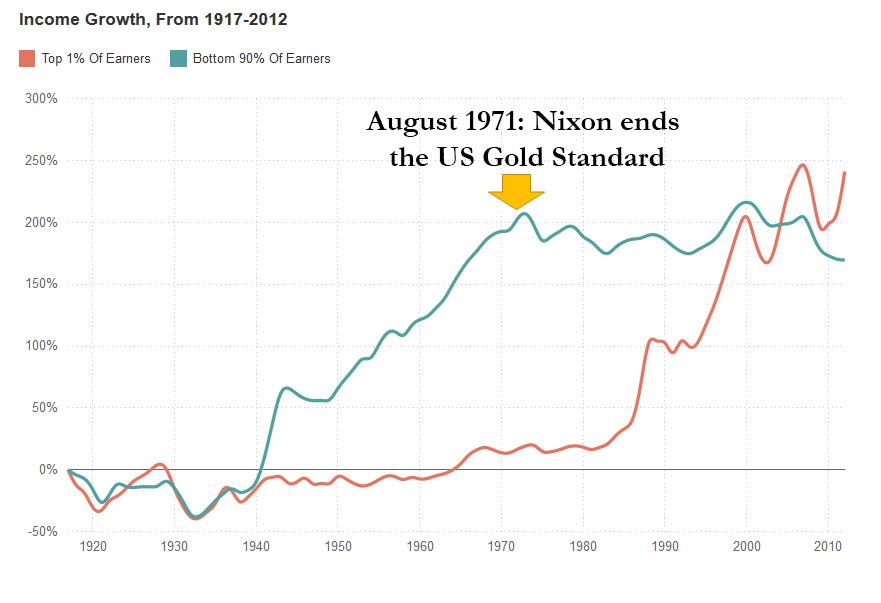
Incidentally, for those curious just what event catalyzed the
unprecedented divergence between America's haves and have nots, we provided
the answer over 4 years ago: the dramatic
ascent of the "Top 1%" of earners at the expense of the "Bottom
90%" started in the early 1970s... when Nixon ended the gold standard.
It is this monetary framework, more than anything, that
the current iteration of the Fed will do everything in its power to protect.
See Chart:
Income Growth from 1917-2012
Should it be successful, one thing is certain:
the implementation of more "bubble" policies that create even greater
social inequality, one which - as the French discovered in the late 18th
century - inevitably culminates in revolution.
Which is, no matter how one gets there, THE END OF THE FED ..
it couldn't come fast enough.
….
SOURCE: https://www.zerohedge.com/news/2019-06-06/how-feds-new-monetary-policy-will-crush-americas-poorest
----
----
"If we
get a jump in claims and a bad report on Friday with jobs, I think the stock
market will be back below 2,700 and the bond yield could be below 2%."
In short, one can see why Wall Street is confused... and recent economic
data is not helping. As BMO's Ben Jeffery writes, there are anecdotes for both
the positive and negative side of the June employment report "with seven positive proxies and five negative
ones."
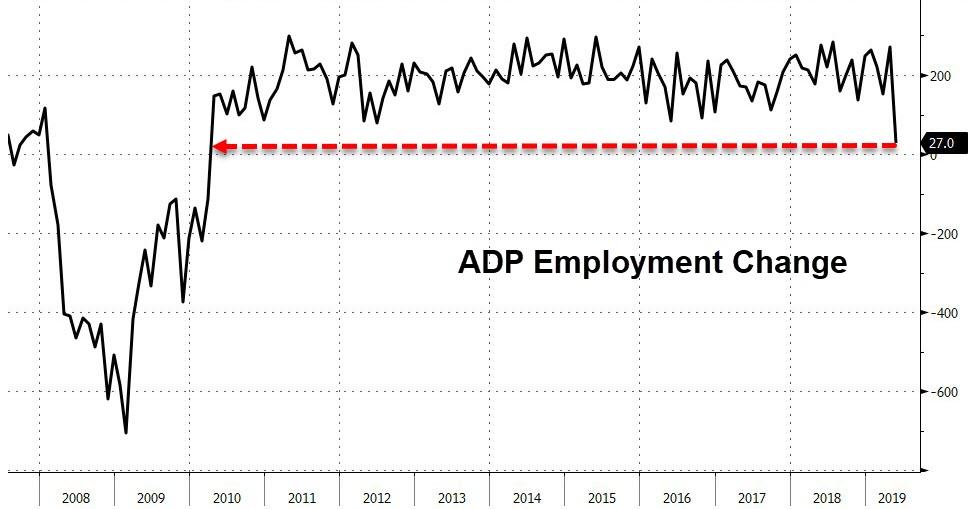
On one hand, in the plus column we have both ISM's employment components
rising from last month, and the labor differential has
climbed to the highest level since 2000. On the other hand, ADP showed the lowest read and largest miss since 2010 and the rise in
Challenger job cuts hints of some downside potential.
See Chart:
ADP Employment Change
US jobs report is projected to show solid Labor
gains in payroll wages
See Chart:
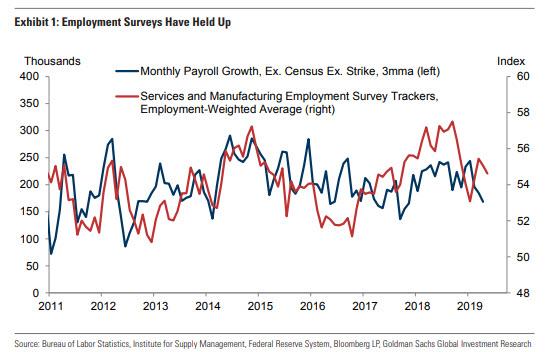
Some more observations on expectations: wages & ADP payrolls & ISM surveys
SeeChart:
Ilya Feygin, senior strategist at WallachBeth
Capital LLC:
“If we get a strong jobs report, probably equities will decline
slightly because the probability of a rate cut would decline. And a good part
of this recent rally was due to more rate cuts priced. It also depends what
average hourly earnings are.”
….
----
----
Will the Federal Reserve be able to once again reignite “Ponzi”
borrowing to suspend that outcome?
Compare and Contrast
The tables below summarize two extreme economic models to exhibit how an
economy dependent upon “Ponzi” financing compares to one in which savings are
prioritized. In both cases, we show how the respective financial decisions
influence consumption, profits, and wages.
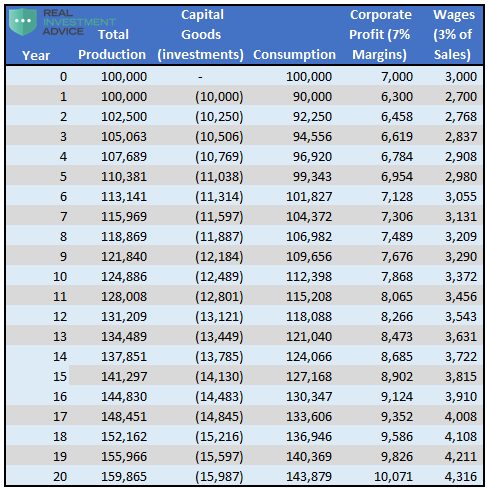
Table 1, below, is based on the assumption that
consumers spend 100% of their wages and borrow an additional amount equivalent
to 10% of their income annually for ten years straight. The debt amortizes
annually and is therefore retired in full in 20 years.
SEE table 1t:
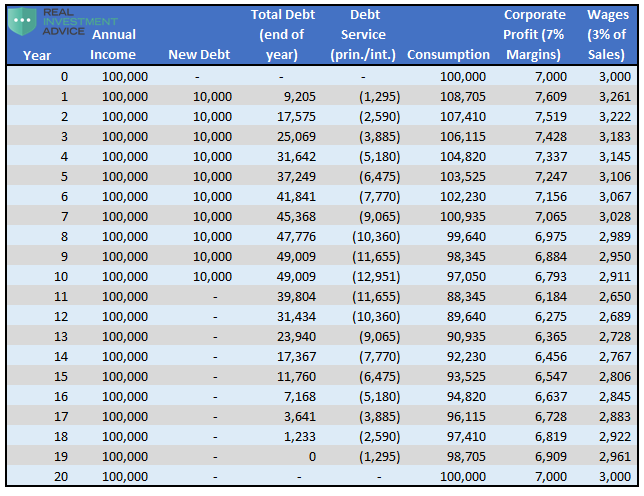
Assumptions: Debt is borrowed each year for the first ten
years at a 5% interest rate and ten year term, corporate profits and employee
wages are 7% and 3% of consumption respectively, annual income is constant at
$100,000 per year.
Table 2, below, assumes consumers spend 90% of
wages, save and invest 10% a year, and do not borrow any money. The table is
based on the work of Henry Hazlitt from his book Economics in One
Lesson.
See Table 2
Assumptions: Productivity growth is 2.5% per year, corporate
profits and employee wages are 7% and 3% of consumption respectively.
Table 1 is the U-VC and Table 2 is the VC. The tables illustrate that
there are immediate economic benefits of borrowing and economic costs of
saving. For example, in year one, consumption in Table 1 rises as a result of
the new debt ($100,000 to $108,705) and wages and corporate profits follow
proportionately. Conversely, table 2 exhibits an initial $10,000 decline in
consumption to $90,000, and a similar decline in wages and corporate profits as
a result of deferring consumption on 10% of the income that was designated for
saving and investing.
After year one, however, the trends begin to reverse. In the U-VC example
(Table 1), when new debt is added, debt servicing costs rise, and the marginal
benefits of additional debt decline. By year eight, debt service costs
($10,360) are larger than the additional new debt ($10,000). At that point,
without lower interest rates or larger borrowings, consumption will fall below
the income level.
Conversely, in the VC example (Table 2), savings and investments engender
productivity growth, which drives wages, profits, and consumption higher.
The graphs below highlight the consumption and wage
trends from both tables.
See Graphs: 1 Consumption:
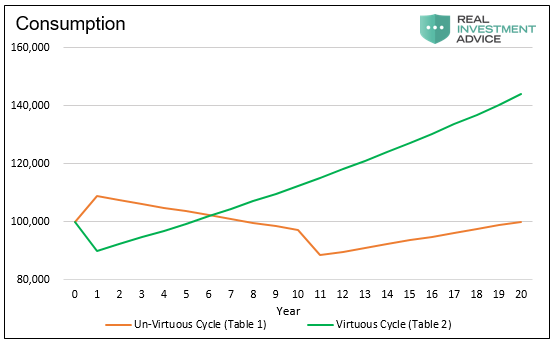
See Graph 2: Wages:
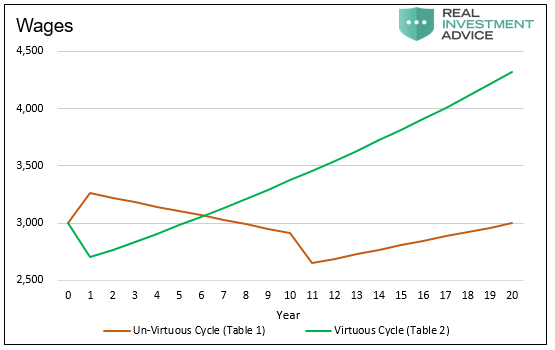
As illustrated in both graphs, the short term justification for promoting
the U-VC is prompt economic growth. Equally important, the reason that savings
and investments in the VC are admonished is that they require discipline and a
period of lesser growth, profits, and wages.
Debt-fueled consumption is an expedient measure to
take when economic growth stalls and immediate economic recovery is demanded.
While the marginal benefits of such action fade quickly, a longer-term policy
that consistently encourages greater levels of debt and lower debt servicing
costs can extend the beneficial economic effects for years, fooling many
consumers, economists and business leaders into believing these activities are
sustainable.
Summary
The U.S. and many other countries are forced to deal with the consequences
of economic policy actions, borrowing, and consumption behaviors from years
past. While the present economic situation is troubling, leadership is
obligated to reflect on past choices and move forward with changes that are in
the best interest of the country and its entire population. As our title
suggests, we can continue to try to pull consumption forward and further harm
future growth, or we can save and reward future generations with productivity
gains resulting in greater economic growth and prosperity.
Shifting direction, and
“paying forward,” via more savings and investments and the deferral of some
consumption, comes with immediate negative consequences to wages, profits, and
economic growth. Nothing worth having is easy, as the saying goes.
….
----
----
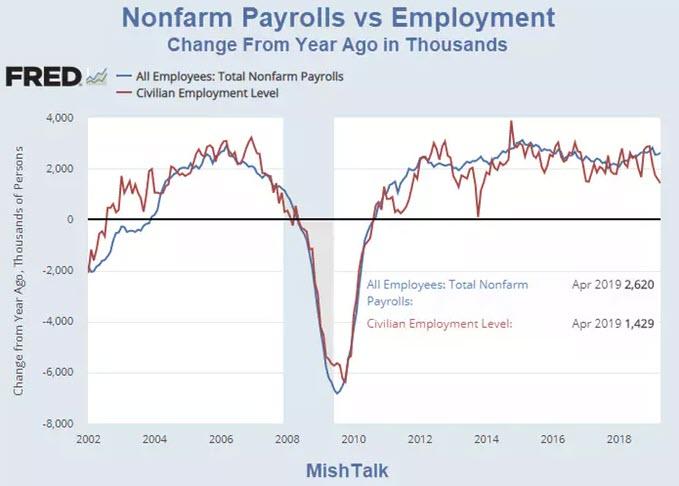
In the past year alone, the difference between jobs and
employment is a whopping 1,191,000. That's a discrepancy of 99,250
every month, in favor of jobs...
See Chart:
Nonfarm payrolls vs Employment
….
----
----
US DOMESTIC
POLITICS
Seudo democ duopolico in US is obsolete; it’s full of frauds & corruption.
Urge cambio
... great wars and engineered economic collapse are their
primary tools to condition the masses to abandon their natural social
and biological inclinations towards individualism and tribalism
and embrace the collectivist philosophy.
The first assumption people make is that that current
system is the ideal globalist system – IT'S NOT EVEN CLOSE.
To summarize:
For at least the past century the globalists have been pursuing a true
one world system that is not covert, but overt. They want conscious public
acceptance of a completely centralized global economic system, a single global
currency, a one world government, and a one world religion (though that particular issue will require an
entirely separate article).
Continue reading at
….
SOURCE: https://www.zerohedge.com/news/2019-06-06/next-stage-engineered-global-economic-reset-has-arrived
----
----
"The control exercised over our awareness is
universal...not only is our
understanding of the economycontrolled by manipulation of our minds, but
also the markets themselves are controlled by official intervention..."
The America I grew up in was an opportunity society. There were ladders of upward
mobility that could be climbed on merit alone without requiring family status
or social and political connections. Instate college tuition was
low. Most families could manage it, and the students of those
families that could not afford the cost worked their way through university
with part time jobs. Student loans were unknown.
That America is gone.
The few economists capable of thought wonder about the high
price/earnings ratios of US stocks and the 26,000 Dow Jones when stock
buy-backs indicate that US corporations see no investment
opportunities. How
can stock prices be so high when corporations see no growth in US consumer
income that would justify investment in the US?
….
We live in a Matrix of
Lies in which our awareness is controlled by the explanations we are given. The
control exercised over our awareness is universal. It applies to
every aspect of our existence. In the article above I showed that
not only is our understanding of the economy controlled by manipulation of our
minds, but also the markets themselves are controlled by official intervention.
In brief, you can believe nothing that you are officially told. If you desire truth, you
must support the websites that are committed to truth.
….
----
----
FASCISTIC CONTROL OF THE PRESS IS ON:
Maybe a better answer for @Jack and Twitter would be to spend less time
policing the web and more time wondering why AOC is so easy to parody to
begin with...
====
THE FOREIGN MARKET IS ALSO CONTROLLED:
"When
faced with more margin pressure, what do you have to do? You have to address
what fixed costs you can remove."
====
"The
level in the chocolate cakewas
higher: more than 250 times the
only federal guidelines..."
====
US-WORLD ISSUES (Geo Econ, Geo Pol & global Wars)
Global depression is on…China,
RU, Iran search for State socialis+K-, D rest in limbo
...wars, particularly world wars, are often
catalyzed by those with a globalized agenda as a way to influence
the masses to abandon concepts like individualism, nationalism, free markets
and sovereignty, and to embrace
collectivism and total globalization.
====
Nasdaq futures have tumbled back into
the red following remarks from President Trump that he isconsidering extending tariffs to China on the
remaining $300 billion of goods.
====
"Our talks with China, a lot of
interesting things are happening. We’ll see what happens... I could go up
another at least $300 billion and I’ll do that at the right time."
====
Disappointingly, for Trump, the deficit with China increased $2.1
billion to $29.4 billion in April, with US
exports to China plunging back near 9 year lows.
….
Esta claro que lo que hace Trump es disparase a los zapatos y pronto su
econpmia no va a poder caminar. Culpar a china .. seria lo mas ridiculo
====
Blackmail on MX for Monday..
this is unfair.. just close the embassy .. move all US t-out
"...position
has not changed, andwe are still moving
forward with tariffs at this time.”
====
El chantaje de las tarifas es una humillacion a
la soberania de MX . The only choice for MX is getting the support of
RU-China & close the US embassy & cut relation with US
"We are optimistic because we had a good
meeting with respectful positions from both parts..."
….
Estamos en visperas del WW3.. MX no necesita del US pero debe reclamar su
neutralidad frente a la ONU. La neutralidad implica la salida immed de US troops
====
SPUTNIK
and RT SHOWS
GEO-POL n GEO-ECO ..Focus on neoliberal expansion via wars
& danger of WW3
----
----
NOTICIAS
IN SPANISH
Lat Am search f alternatives to
neo-fascist regimes & terrorist imperial chaos
REBELION
Mund: ¿Paz? Stephan Kaufmann
====
ALAI ORG
====
RT EN ESPAÑOL
- México se compromete con EE.UU. a desplegar 6.000 efectivos de la Guardia Nacional en la frontera con Guatemala
- Aranceles y 'crisis migratoria': Así va el pulso entre EE.UU. y México
- ¿Por qué los "sospechosos" ingresos de un ministro de la Corte sacuden la política en México?
- EE.UU. habría decidido dejar de entrenar a pilotos turcos en los F-35 por la compra de los S-400 rusos por Ankara
- Estas son las ocho nuevas funciones más útiles del próximo iOS 13
- Trump: "Con el respaldo de los demócratas haríamos que México se doble como un paraguas"
- Trump a México: "Cuando eres la alcancía a la que todos roban durante 25 años, los aranceles son una cosa hermosa"
- Keiser Report " US se volvio loco al inic guer com con Méx, China y Europa"
----
----
INFORMATION
CLEARING HOUSE
Deep on the US political
crisis: neofascism & internal conflicts that favor WW3
-Trump & NATO warmongers proclaim peace By Finian Cunningham
-Smearing China By Kim Petersen
-N- American, European Public: Finally Wake
Up, Damn It! By Andre Vltchek
-The State of the Economy By Paul Craig Roberts
-Donald Trump in the role of his life By César Chelala
-UN Special Rapporteur on Torture warns Julian
Assange could die in prison
By Kevin Reed FREE JULIAN ASSANGE
By Kevin Reed FREE JULIAN ASSANGE
-----
----
COUNTER
PUNCH
Analysis on US Politics &
Geopolitics
Lawrence
Davidson Cover
Ups and Truth Tellers
George
Ochenski What
Will It Take to Stop Trump’s Climate Policy Insanity?
Dean
Baker The
Wonderful World of Free Market Drugs
Binoy
Kampmark Cults of
Impeachment
Michael
T. Klare The
Pentagon’s Spoiling for a Fight … But With China, Not Iran
Thomas
Knapp The
First Amendment Protects Ex-Politicians Too
----
----
GLOBAL
RESEARCH
Geopolitics & Econ-Pol
crisis that leads to more business-wars from US-NATO allies
----
----
DEMOCRACY
NOW
Amy Goodman’ team
----
----
PRESS
TV
Resume of Global News described by Iranian observers..
----
===
No hay comentarios:
Publicar un comentario