ND MAY 15 19 SIT EC y POL
ND denounce Global-neoliberal debacle y propone State-Social
+ Capit-compet in Eco
ZERO HEDGE ECONOMICS
Neoliberal globalization is over. Financiers know it, they
documented with graphics
EL COLAPSO
NEOLIBERAL AT GLOBAL LEVEL (EXCEPT china ) NO LO
PARA NADIE
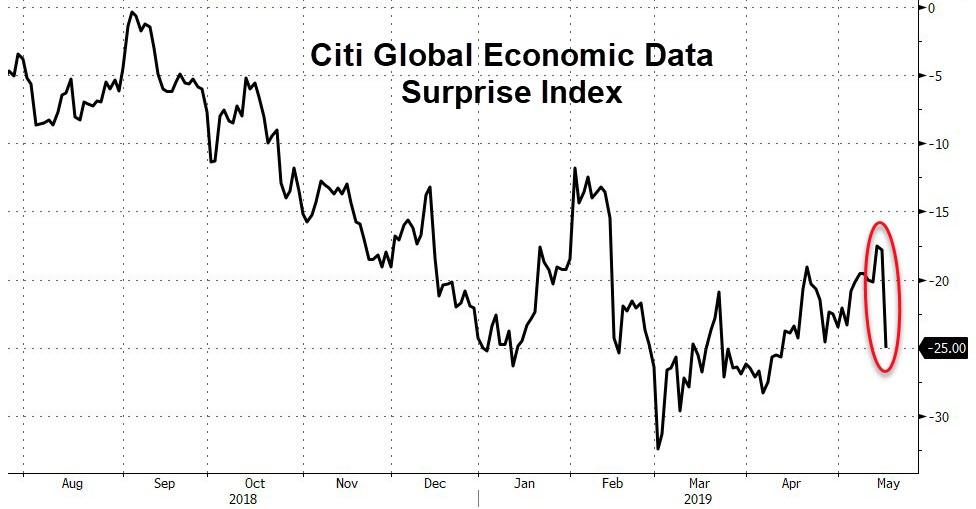
The last 24 hours in global economic
data has been the second biggest
disappointment in over 5 years...
See Chart:
Citi Global Economic Data: Surprise Index
So it all makes perfect sense that
stocks were bid...
See Chart:
Chinese
stocks rallied because bad news (dismal industrial production and retail sales)
is good news for more stimulus, right? because that has worked so well
before?
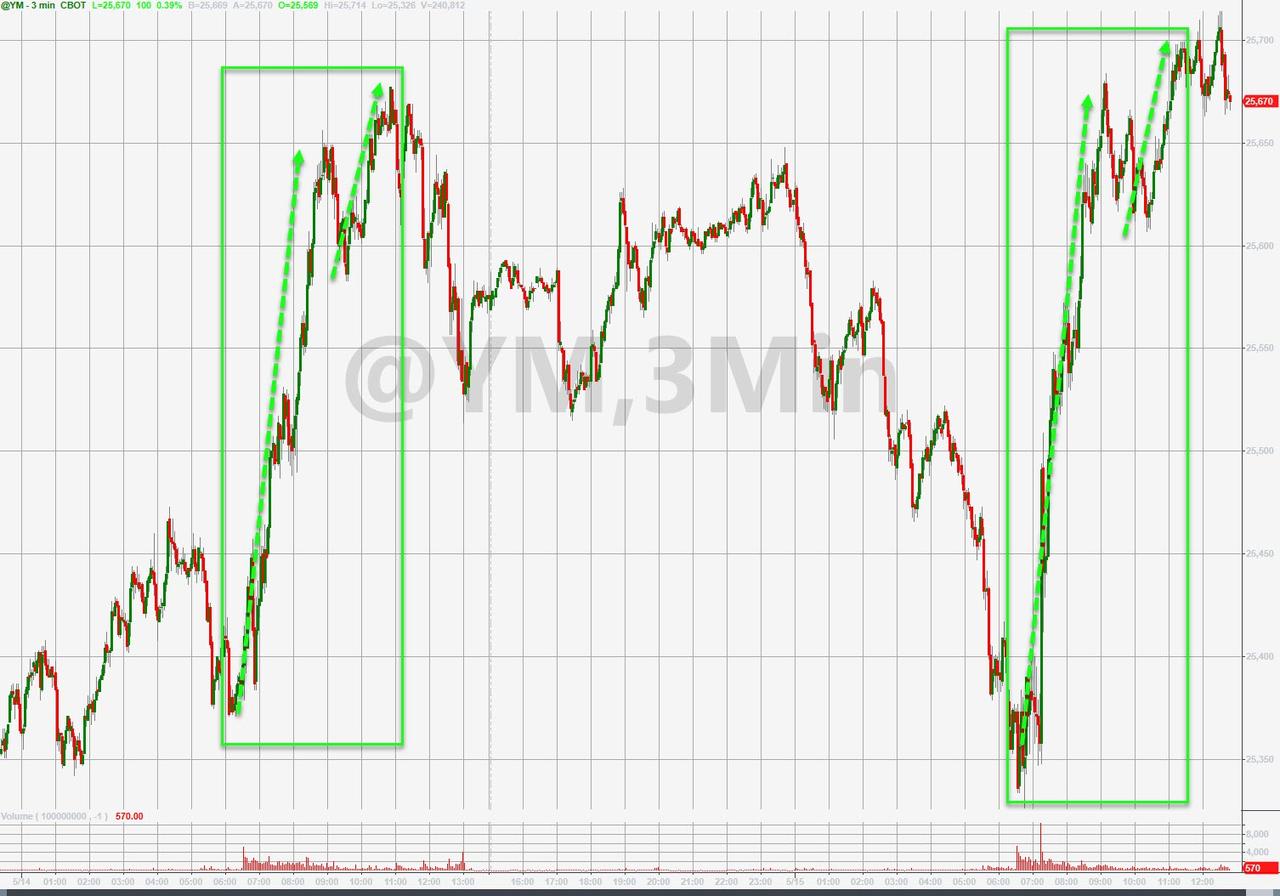
US markets were a combination of
shitty data (yay easy Fed) and delayed tariffs (yay buy auto makers) that
levitated stocks in a deja vu move from yesterday...
See Chart:
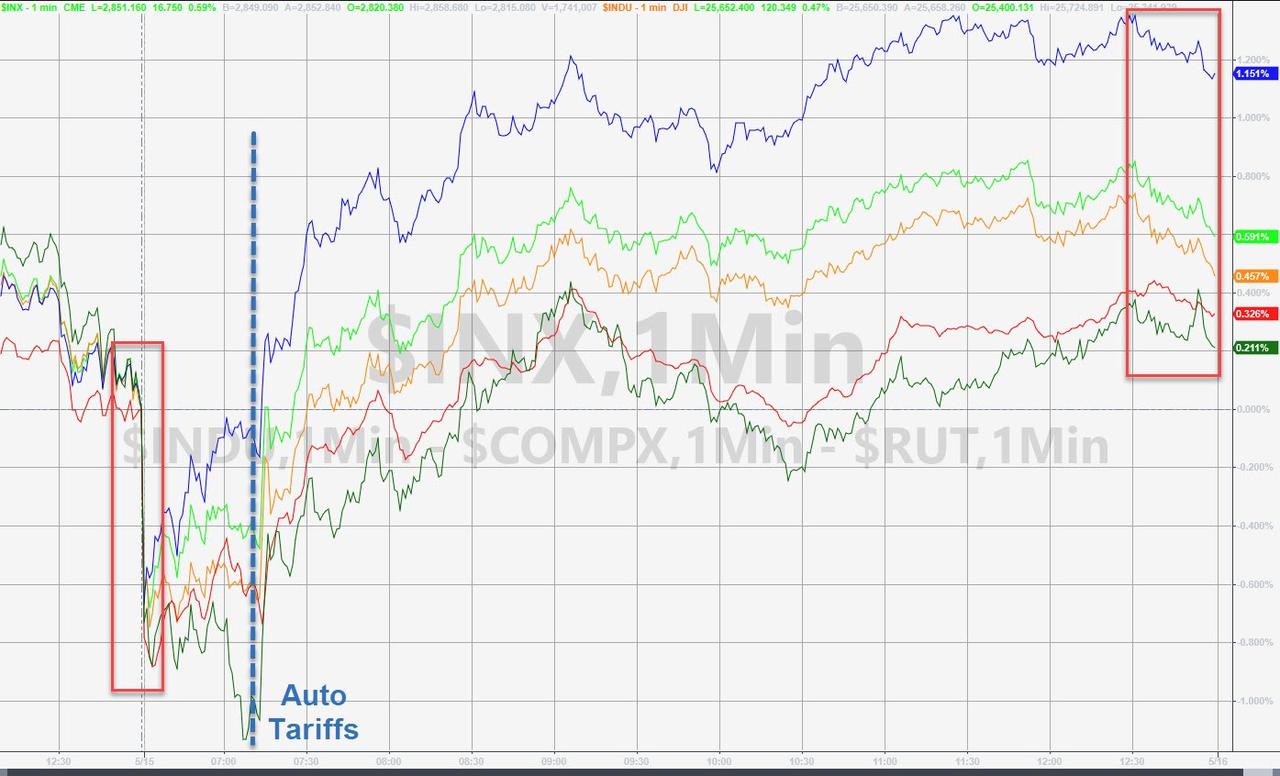
Nasdaq led the bounce followed by
S&P after a weak overnight and open...and following yesterday's pattern of
a dead cat bounce, it was an ugly close...
See Chart:
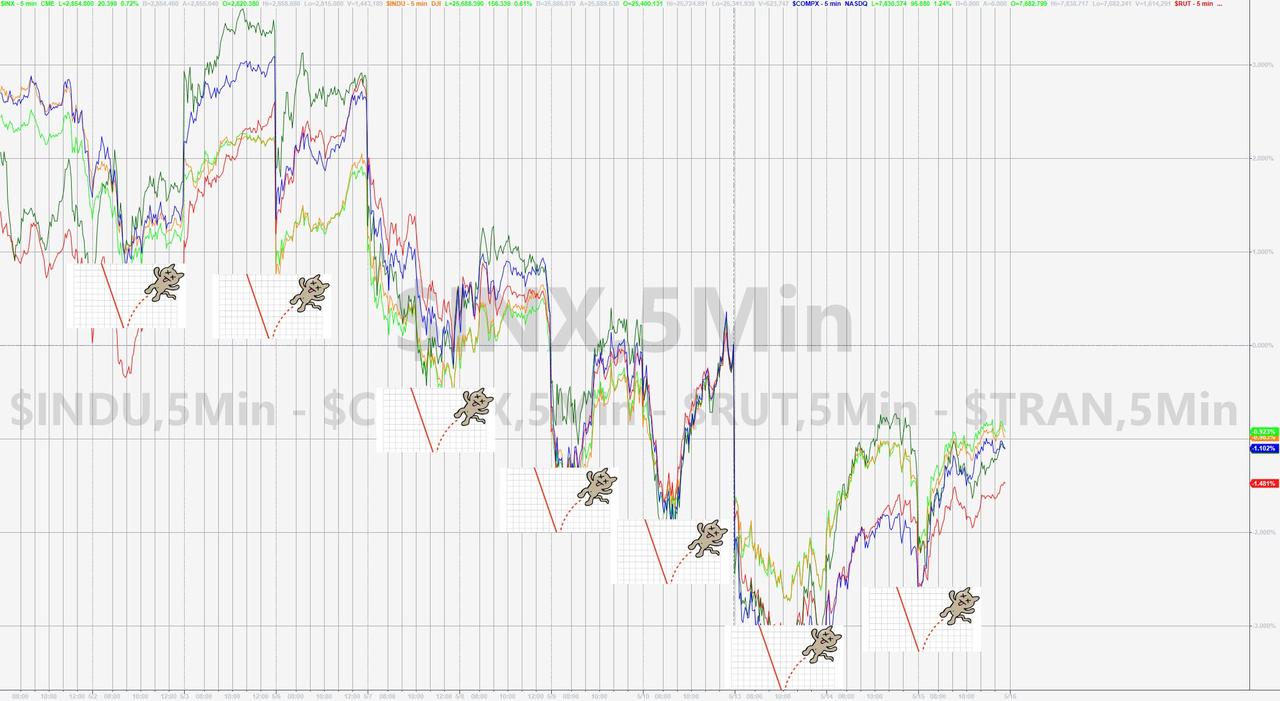
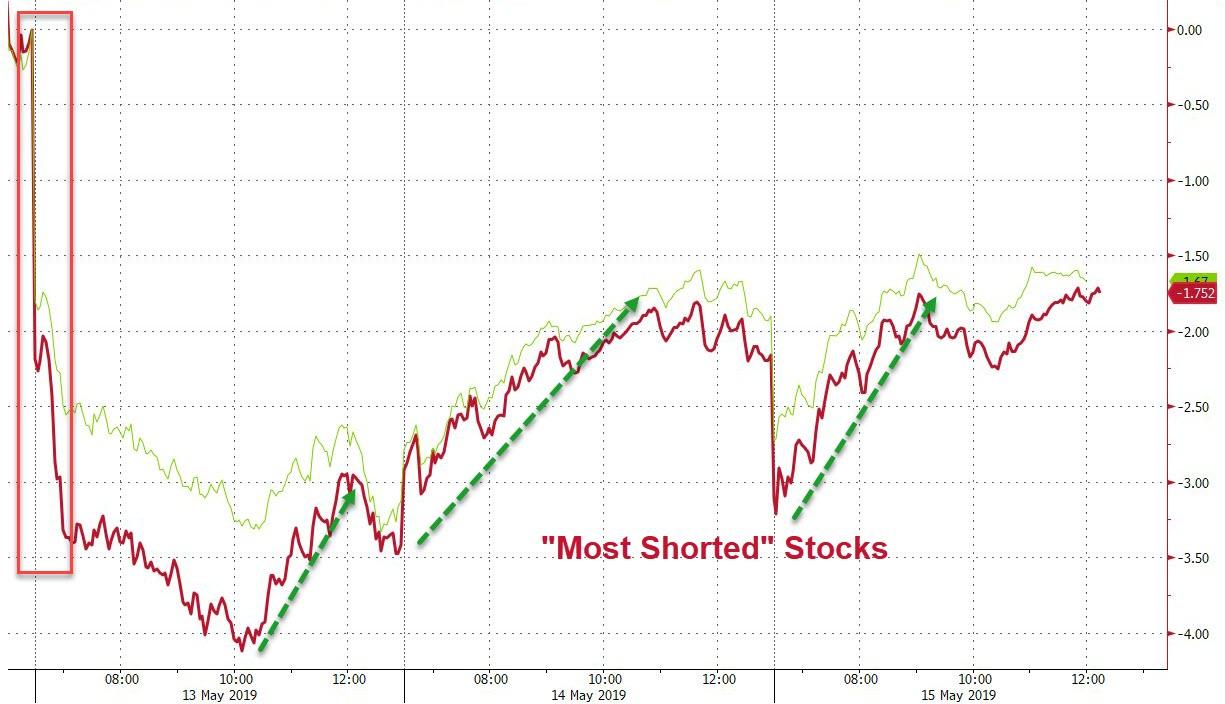
Lower lows and lower highs...
Big short squeeze delivered the
gains today...again...
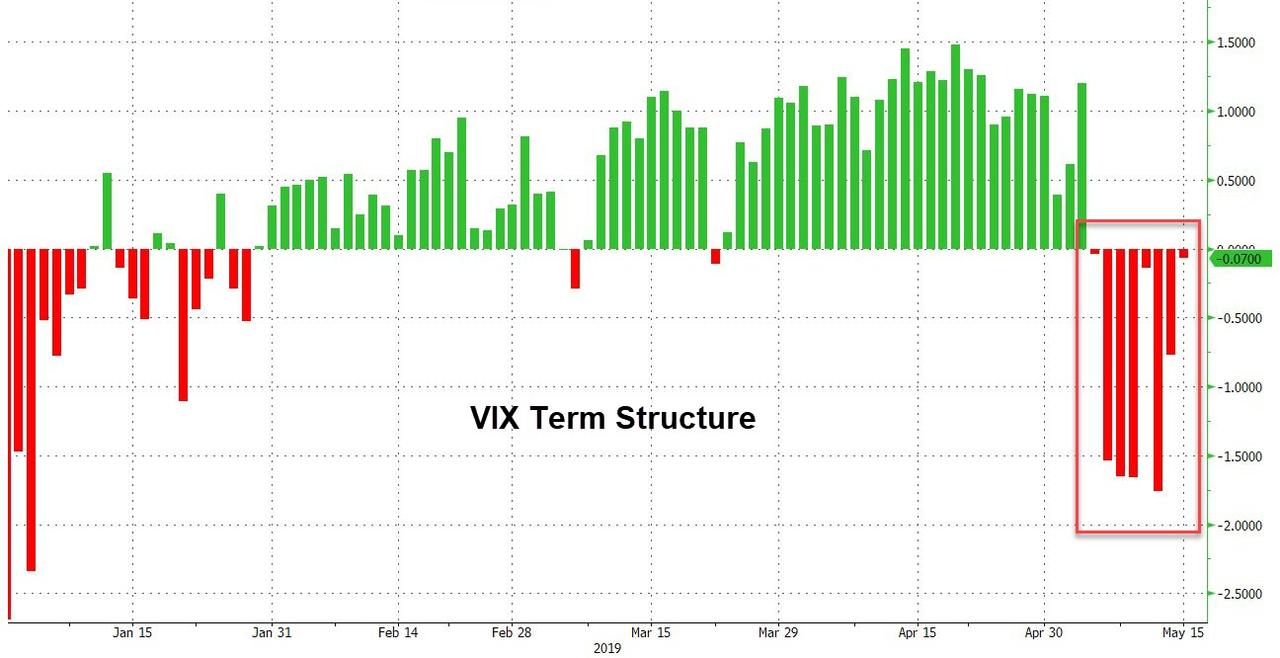
The Vix Term structure remains
inverted for the 8th day in a row...
See Chart:
VIX Term Structure
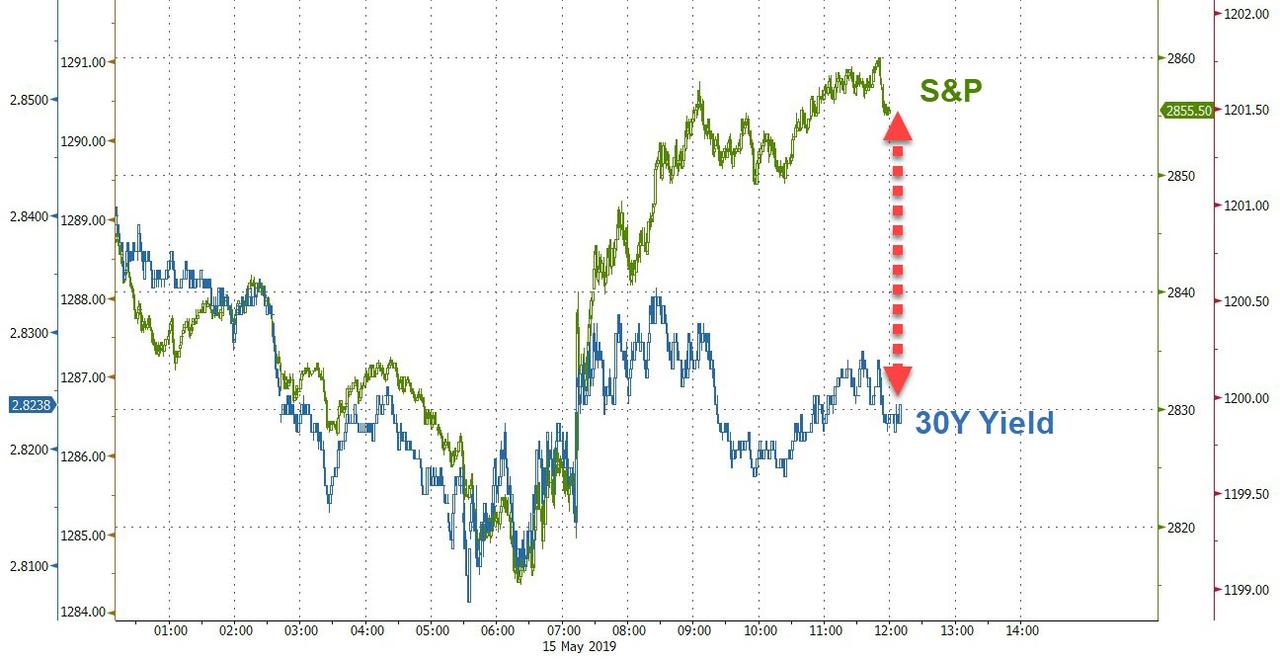
There was a notable decoupling
between bonds and stocks on the day
See Chart:
S&P vs. 30Y Yield
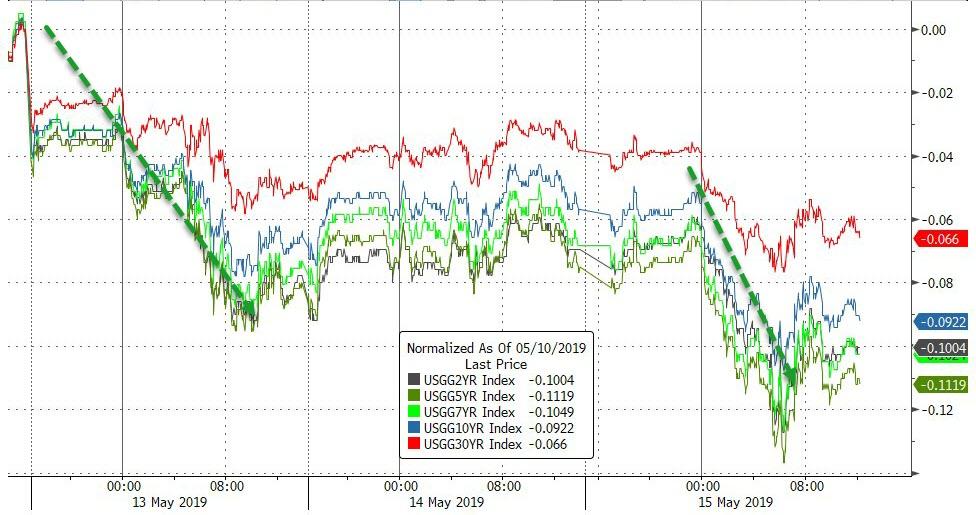
Treasury yields were down around
3bps across the curve today, even as stocks soared
See Chart:
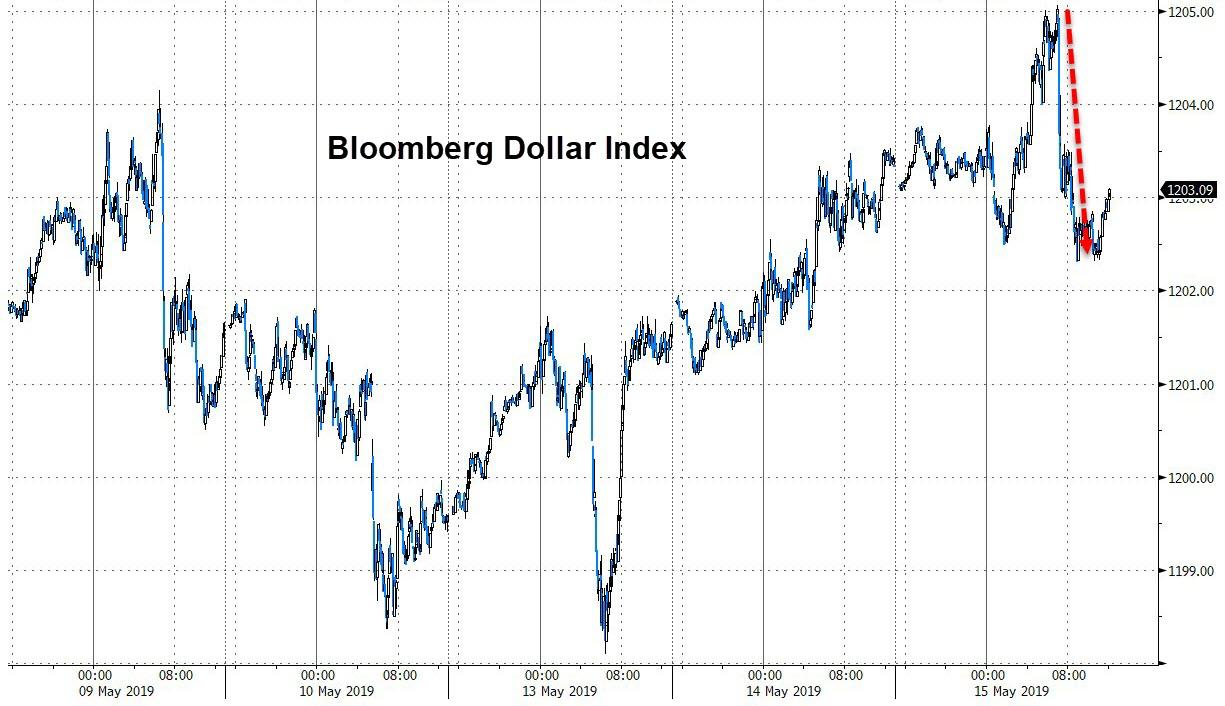
The Dollar Index extended gains
overnight but plunged when the auto tariffs headlines hit sparking a big bid
for Euros...
See Chart:
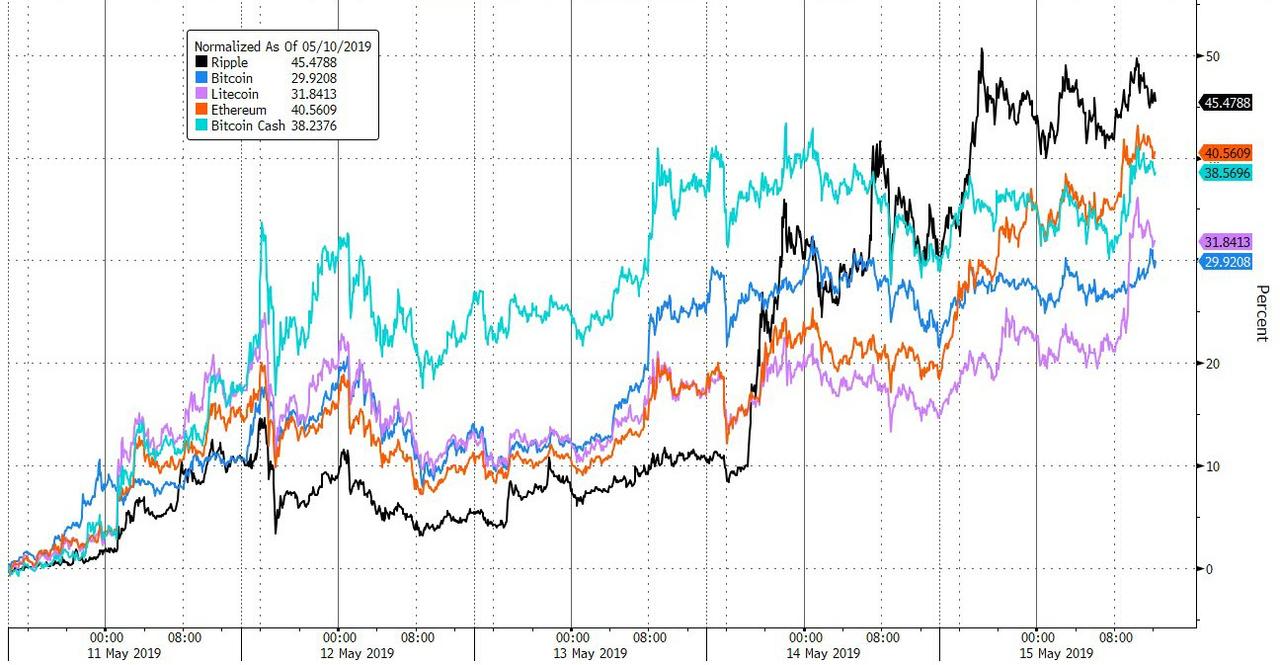
Cryptos continued to rally...
See Chart:
With Bitcoin back above $8000
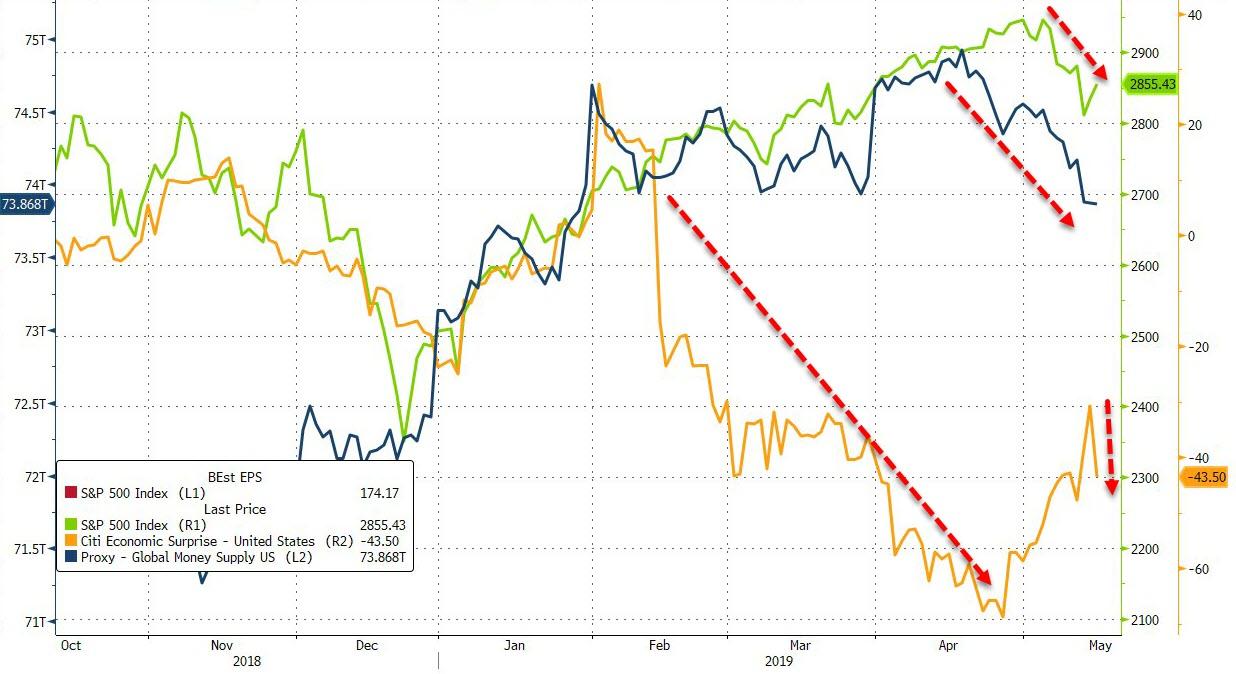
Finally, global money supply and
fundamentals are no longer supporting stocks...
See Chart:
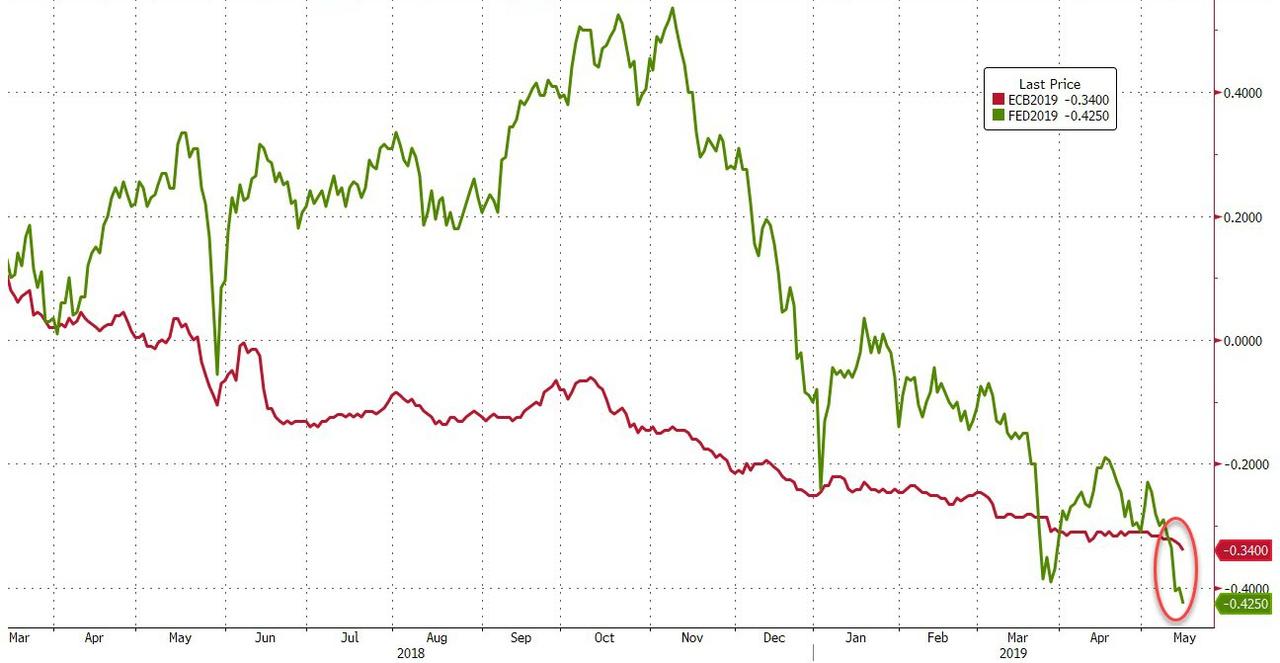
And despite all the talk about how
bad Europe is compared to 'green-shoot'-ing America - US markets are now priced
for a more dovish Fed this year than the ECB...
See Chart:
….
SOURCE: https://www.zerohedge.com/news/2019-05-15/stocks-bonds-bitcoin-jump-global-economic-data-dumps
----
----
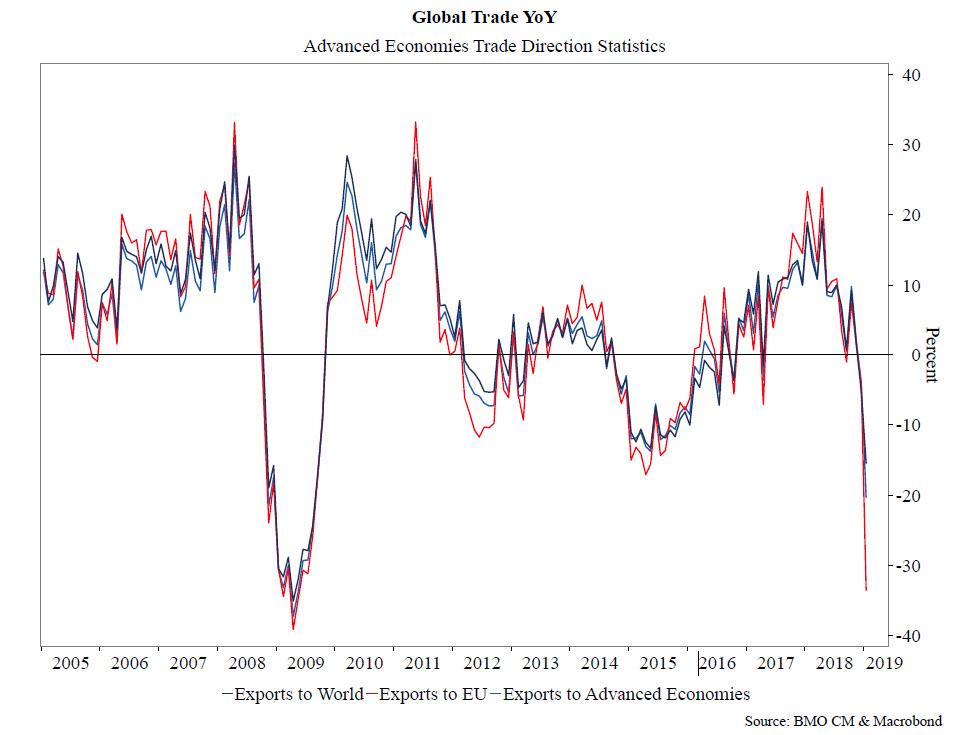
Even before
the latest round of trade escalation, global trade had tumbled to levels last
seen during the financial crisis depression
See Chart
Global Trade YoY. Advanced Econ
Trade Direction Stats
https://www.zerohedge.com/s3/files/inline-images/global%20trade%20IMF%20may%202019.jpg?itok=CGSZkdPi
….
----
----
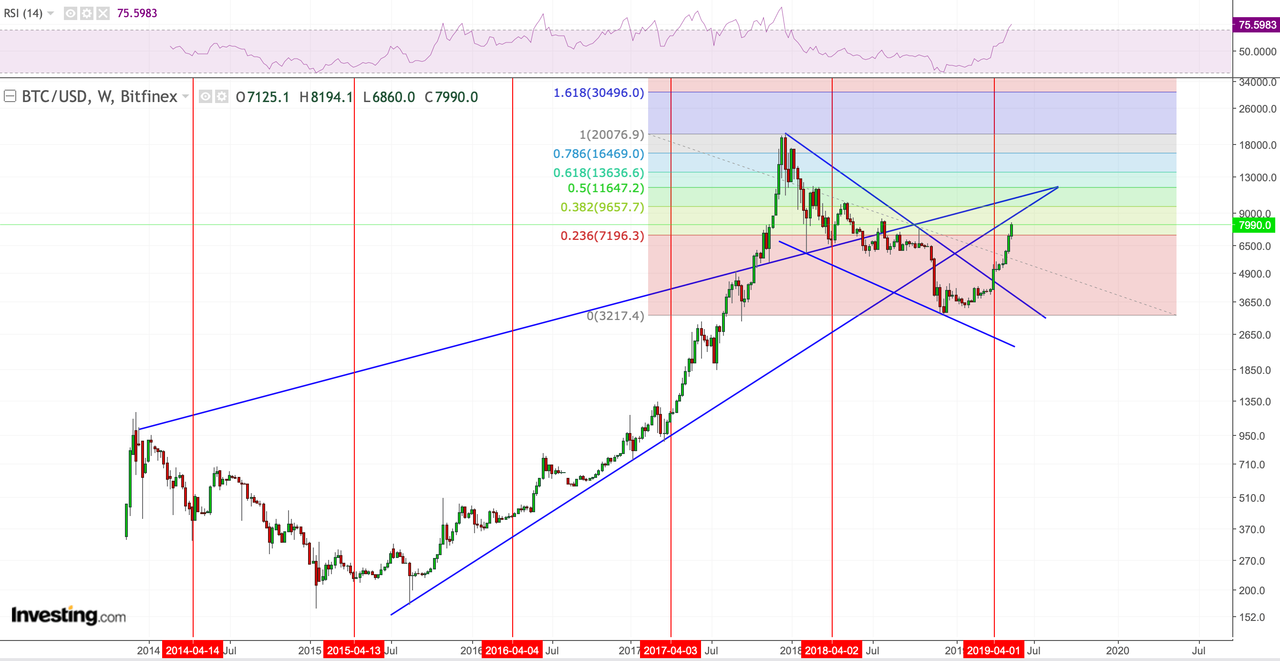
BTC is getting close to a major
trend line and has to prove its case there...
Here’s the chart and then some thoughts:
Chart:
Investing
The first
observation is not technical, it’s more of a seasonal observation. In
recent years $BTC has shown rallies to emerge following the early April time
frame. Sometimes these rallies produce new highs later in any given year or
these rallies peter out. This year so far is following the seasonal script of a
post early April rally, so in context of its history this rally here should
probably not surprise.
Now to the technical.
$BTC has
respected multiple trend lines over the past few years.
On the left side $BTC created a top
trend line in 2017 connecting to 2014 which was subsequently busted through
when $BTC went on its vertical move in 2018. Normally I would view this trend
line as no longer valid, but this trend line reasserted its relevance as it
became clear support after the initial crash following the move to $20,000.
That support ultimate failed and then turned into resistance later in 2018.
But first things first. $BTC is getting close to a major trend line and has to prove its case
there.
For now $BTC has shown 2 things:
1. It has
followed its seasonal pattern and produced a rally following that script.
2. It has
acted technically by breaking above a bullish falling wedge.
Now it needs to prove its case by showing a positive
reaction in dealing with the trend line above or risk a sizable reversal.
There, that’s what I see. I wish everyone trading/holding it the best of luck. And since I’m
known for the occasional sarcasm, let me clarify I really mean it: I wish everyone the best on it. Good luck!
….
----
----
The global
liquidation continues.
…
We pushed a fake economy & hide
facts.. and now we lost the Econ-war… With the friends we have (Canada case) we
don’t need enemies
…
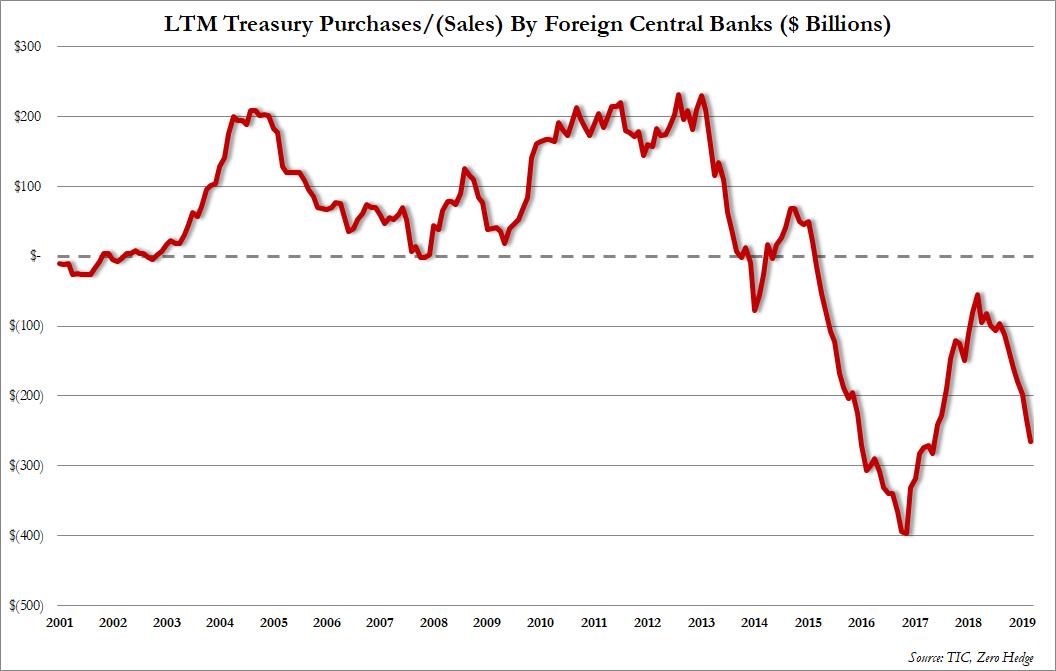
... foreign central banks dumped
Treasuries for the 6th consecutive month (-$170BN), and 11th of last 12 months
(-$265 BN)...
See Chart:
LTM Treasury Purchases/sales by
Foreing Central Banks ($Blls)
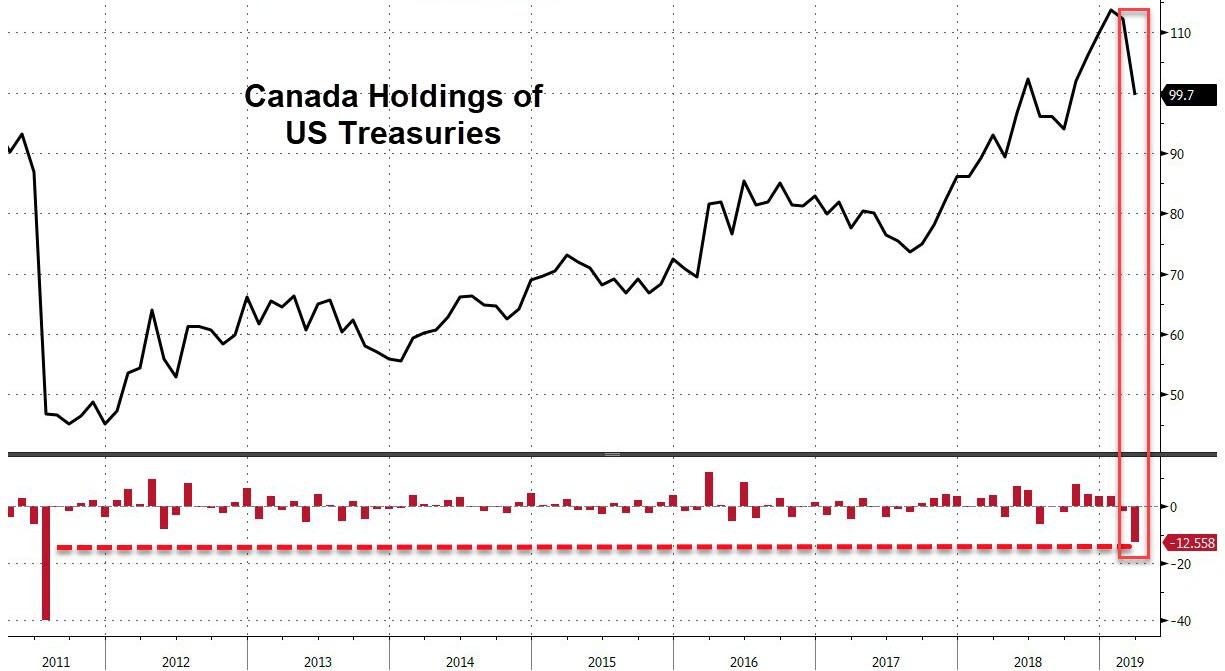
However, it wasn't China that was
the most aggressive seller of US paper in March, but rather America's friends
to the north - Canada - who dumped $12.5 billion, the biggest drop since July
2011.
See Chart:
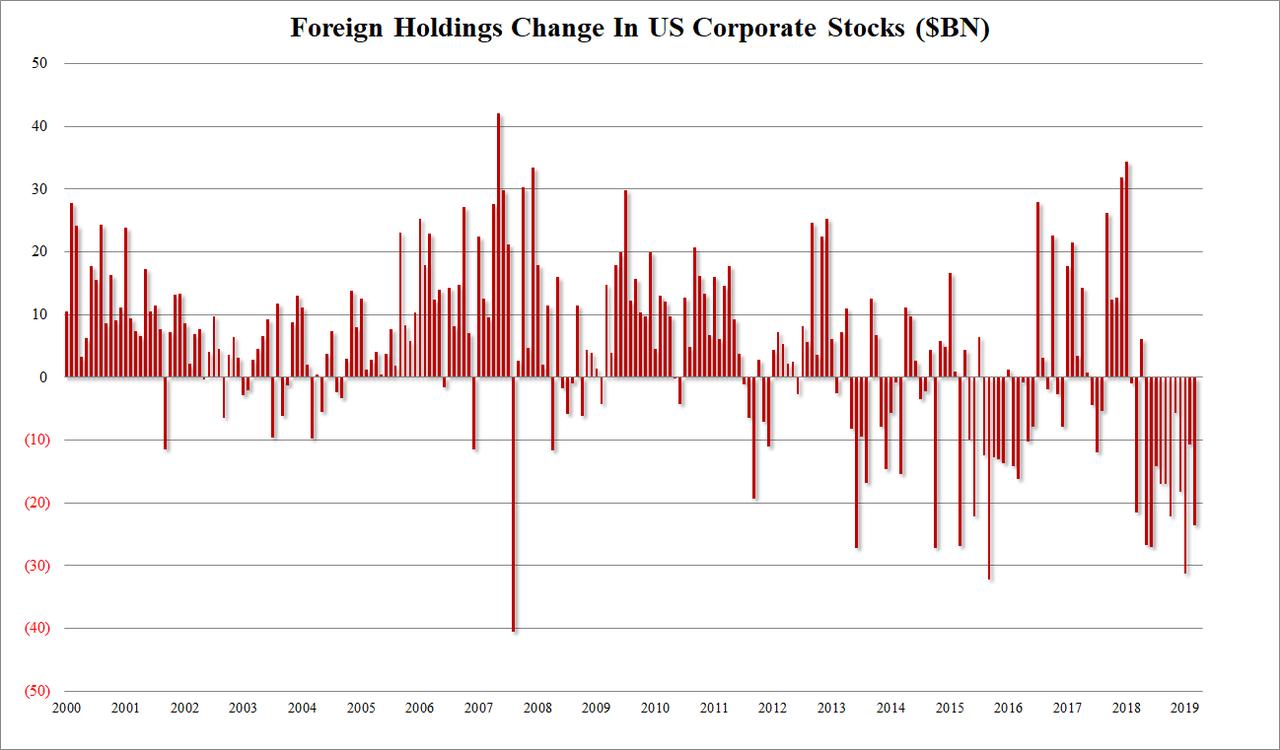
For yet another month, the real
action was away from the bond market, and in US stocks, where TIC data showed
that foreigners sold US stocks for a record 11th consecutive month and 13 of
the past 14:
See Chart:
Foreign Holding Change in US
Corporate Stocks (SBN)
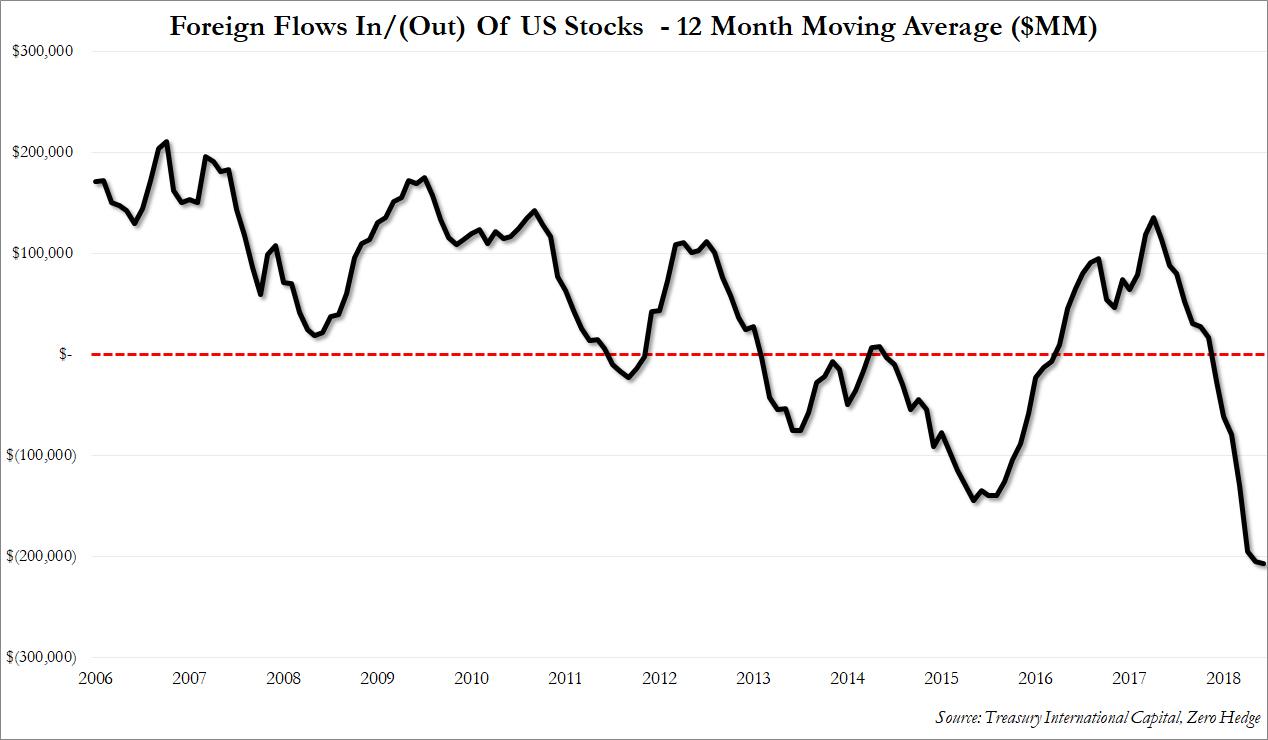
The
aggregate $207 billion sale in the past 12 months, is the largest liquidation
of US equities by foreigners on record.
See Chart:
Foreign flows in/out of US Stocks
-12 Months Moving average ($MM)
What is odd, is that in March US
stocks barely shuddered and after several attempts at taking out 2,800 in the
S&P, the finally pushed right through, despite what we now know was
relentless selling by both individual and institutional investors, and - now -
also by foreigners. Which once again begs the question, just how powerful are
stock buybacks - which were the only official buyers of stocks in May - to not
only offset selling by virtually everyone else, but also push the market to new
highs?
…
SOURCE: https://www.zerohedge.com/news/2019-05-15/foreigners-dump-record-265-billion-us-stocks-past-year
---
---
RELATED:
"...the trade war is a
farce. When it comes to the elites of China and the US, there is no division and no conflict.
They all want the same thing - global
centralization."
====
----
With the national debt spiraling quickly out of control, there are only a few years left before every single
dollar the government borrows will go toward funding interest payments on the
national debt...
The Independent Blog said
that the main takeaway from the Debt Management Office’s Fiscal
Year 2019 Q1 Report, which featured the Office of Management and Budget’s
latest projection of the U.S. government’s borrowing
from the public, is shown in the chart below:
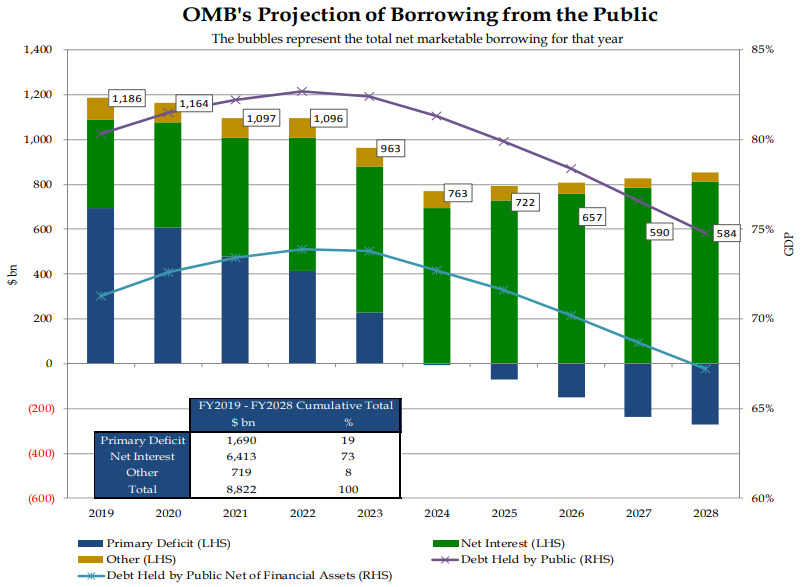
See Chart:
ZeroHedge explains the
significance of what the chart shows as the Primary Deficit, indicated as the
blue portion of the bars in the chart, swings from positive to negative
beginning in 2024:
As part of today’s Treasury
Presentation to the Treasury Borrowing Advisory Committee, there is a chart
showing the Office Of Debt Management’s forecast for annual US debt issuance,
broken down between its three component uses of funds: Primary Deficit, Net
Interest Expense, and “Other.”
That chart
is troubling because while in 2019 and 2020 surging US interest expense is
roughly matched by the other deficit components in the US budget, these
gradually taper off by 2024, and in fact in 2025 become a source of budget
surplus (we won’t be holding our breath).
But what is the real red flag is that starting in 2024, when the primary
deficit drops to zero according to the latest projections, all US debt issuance will be used to fund the US net interest
expense, which depending on the
prevailing interest rate between now and then will be anywhere between $700
billion and $1.2 trillion or more.
In short:
in the stylized cycle of the US “Minsky Moment”, the US will enter the
penultimate, Ponzi Finance,
phase – the one in which all the new debt issuance is used to fund only interest on the debt – some time around in 2024.
–ZeroHedge
Once we reach that point, the government will have reached the “death spiral,” a point at which the
complete collapse of the government and financial system is imminent.
Don’t
hold your breath that the U.S. government will quell it’s spending habits.
H/T [The
Independent Blog]
….
----
----
US
DOMESTIC POLITICS
Seudo democ duopolico in US is obsolete; it’s full of frauds
& corruption. Urge cambio
Political can-kicking on Social Security may leave millennials and Generation Z in the Wintry
Cold...
====
Durham is a tough U.S.
attorney with a resume that includes
investigations into high-level government corruption.
====
“Notably, approvals of new conventional oil and gas projects fall short of what would be needed to meet
continued robust demand growth...”
====
The
Commerce Department said Wednesday it has reasonable basis to believe that "Huawei is engaged in activities
that are contrary to US national security."
====
US-WORLD ISSUES (Geo Econ, Geo Pol & global Wars)
Global depression is on…China, RU, Iran search for State
socialis+K-, D rest in limbo
Iran's
Minister of Defense vowed, "We
will defeat the American-Zionist front."
====
SPUTNIK and RT SHOWS
GEO-POL n GEO-ECO
..Focus on neoliberal expansion via wars & danger of WW3
----
----
NOTICIAS IN SPANISH
Lat Am search f alternatives to neo-fascist regimes &
terrorist imperial chaos
REBELION
ARG: La vuelta del trueque María Florencia Alcaraz
FEM: Una lectura feminista de la deuda Verónica Gago y Luci Cavallero
Iran: De sancionar a Irán a ir a
la guerra? H A. Khan Ni
sancion ni guerra
====
ALAI ORG
====
RT EN
ESPAÑOL
- ¿Golpe a Huawei?: Trump firma
una orden ejecutiva que declara "emergencia nacional" por
amenazas contra la tecnología estadounidense
- La reforma educativa de López
Obrador ya es una realidad en México
- Washington Post destapa un plan
secreto de EE.UU. contra miles de migrantes
- Periodista canadiense:
"Venezuela no es Siria, pero las tácticas de guerra de EE.UU. son las
mismas"
- Europa, una nueva grieta en
Estados Unidos
- Departamento de Comercio de
EE.UU. incluye en su 'lista negra' a Huawei y 70 empresas afiliadas
- Gobierno y oposición venezolana
inician acercamientos en Noruega
- Brasil se paraliza por huelga
nacion de la educ: ¿cuáles son los reclamos?
- EE.UU. suspende vuelos a
Venezuela por motivos de seguridad
- Rusia aprueba su nueva doctrina
de seguridad energética: ¿Qué implica?
- Putin sobre Ado nuclear iraní:
"Rusia no es un equipo de bomberos, no podemos salvarlo todo"
- El
Zoom EE.UU. y Rusia: Buscando el
equilibrio
----
----
COUNTER
PUNCH
Analysis
on US Politics & Geopolitics
Kenneth Surin Israel/America
or Netanyahu/Trump?
Patrick Cockburn EU
is Powerless in Growing Conflict Betw the US and Iran
W. T. Whitney Criminal
Affair: US Imposes War on the Venezuelan People
John Feffer The
Threat of Political Climate Change
----
----
GLOBAL RESEARCH
Geopolitics & Econ-Pol crisis that leads to more
business-wars from US-NATO allies
----
----
DEMOCRACY NOW
Amy Goodman’ team
----
----
PRESS TV
Resume of Global News described by Iranian observers..
- Iran
enemies have reached end of the line: IRGC
- US
sanctions on Iran ‘crime against humanity’: Rouhani
- Trump
denies infighting in WH over Iran
- Putin:
Russia sorry to see Iran nuclear deal unravel
- Global
oil supplies take major hit amid US-Iran tensions
- Germany,
Netherlands halt Iraq military training
- Watch
how Yemenis shoot down US-made Saudi predator
- Over
60 Palestinians injured in Nakba Day protests
- UAE
gives 3 Hezbollah-linked Lebanese long jail terms
- UK
Foreign Office in ‘crisis mode’ over Iran
- 'Iran
ready for any eventuality on nuclear issue’
- Resistance
fighters never give up arms: Hamas
- PROGRAMS
- India's
elections: How has it faired under Modi?
- U.S.
Anti-Iran Campaign
- Yemen
Saudi attacks
- Iran’s
reduction of compliance with JCPOA
- Deal
of the century and Trump's veto on Yemen
- Oil
tanker attacks off UAE coasts
----
===
FEM: Una lectura feminista de la deuda Verónica Gago y Luci Cavallero
No hay comentarios:
Publicar un comentario