DEC 7 20 ND SIT EC y POL
ND denounce Global-neoliberal debacle y propone State-Social + Capit-compet in Eco
ZERO HEDGE ECONOMICS
Neoliberal globalization is over. Financiers know it, they documented with graphics
BONDS & BULLION BID AS STOCKS SKID ON STIMULUS/VACCINE STUMBLE
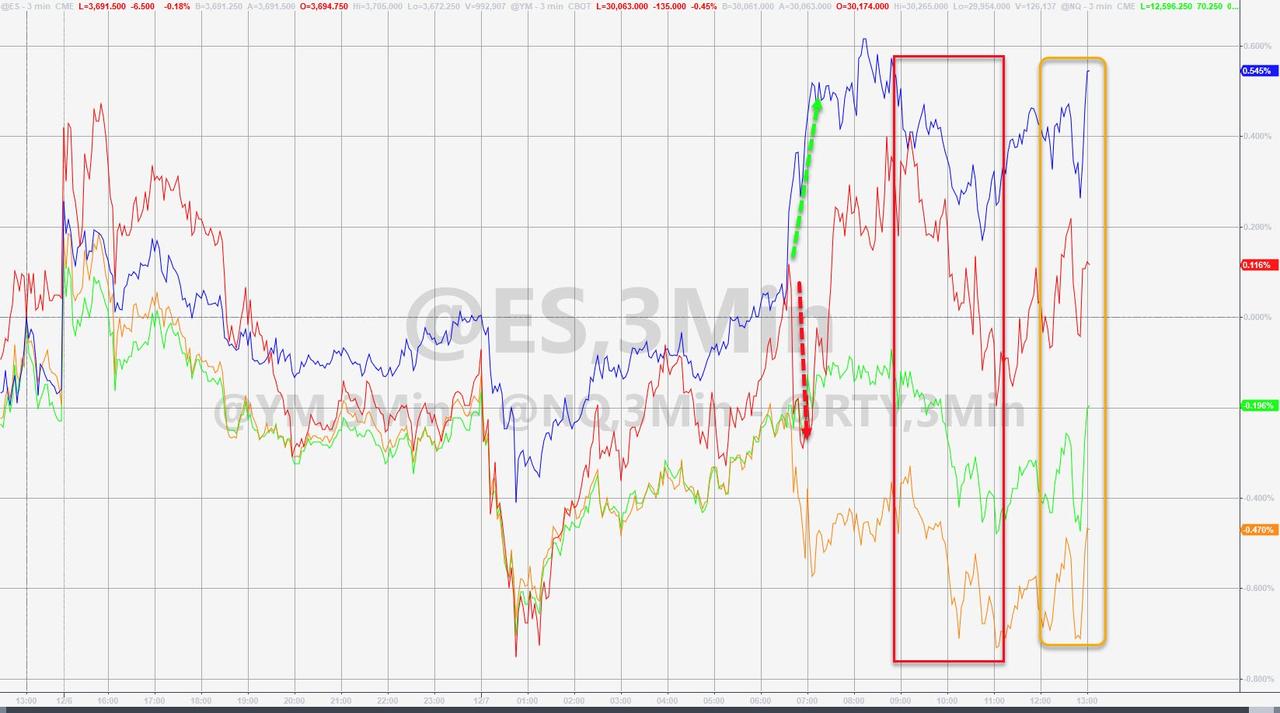
For a few brief moments today, stocks rallied to record highs and all was fixed in the world as leaked "scoops" suggested Mitch McConnell was readying a $900bn COVID Relief Bill that might just work... but then that was dismissed and algos refocused on disappointing vaccine headlines once again...
"You shall not pass" the bill...
Here's what that looked like in markets. Nasdaq held gains while Dow and S&P were red with Small Caps trying hard to eke out some gains...
https://www.zerohedge.com/s3/files/inline-images/2020-12-07_13-00-03.jpg?itok=vds3q-Bw
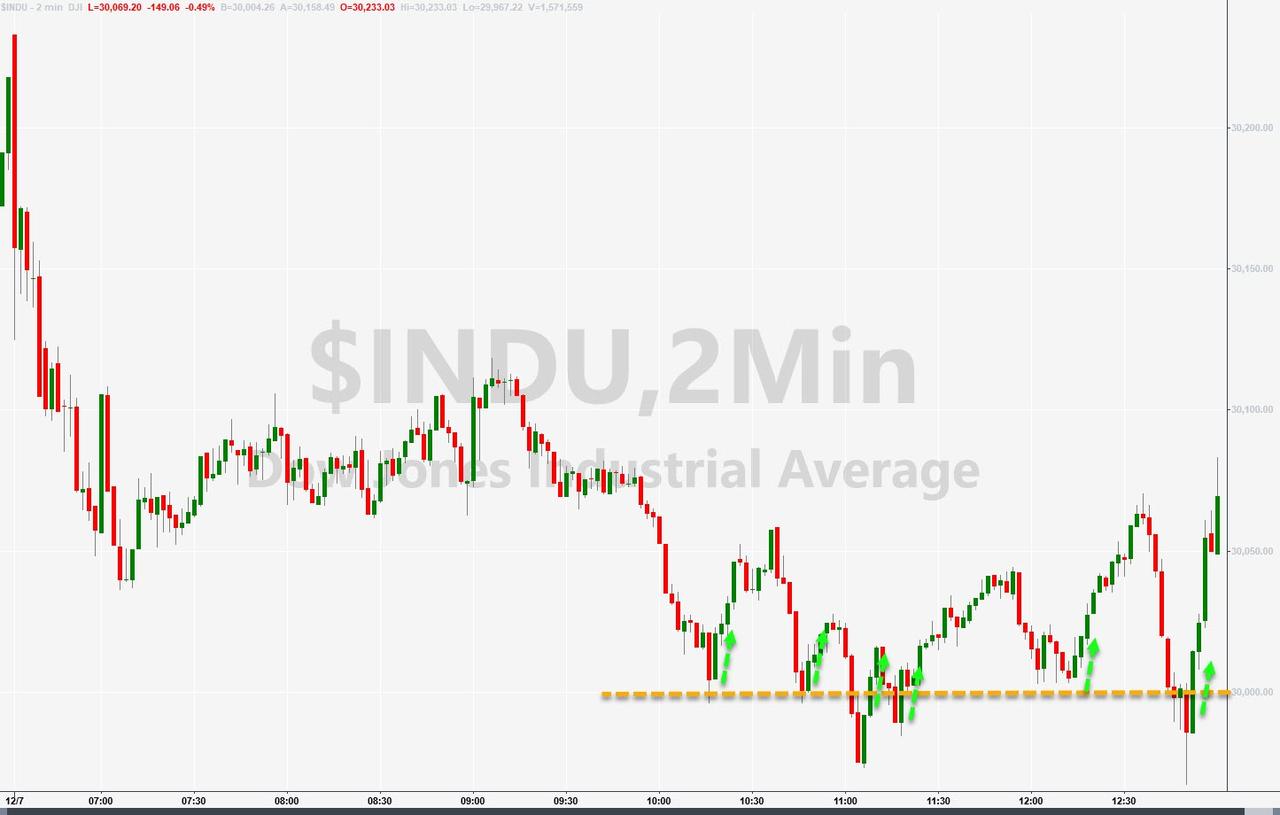
The Dow battled for 30k in the afternoon before the late-day buying-panic hit...
See Chart:
https://www.zerohedge.com/s3/files/inline-images/2020-12-07_13-00-54.jpg?itok=x9VZQe00
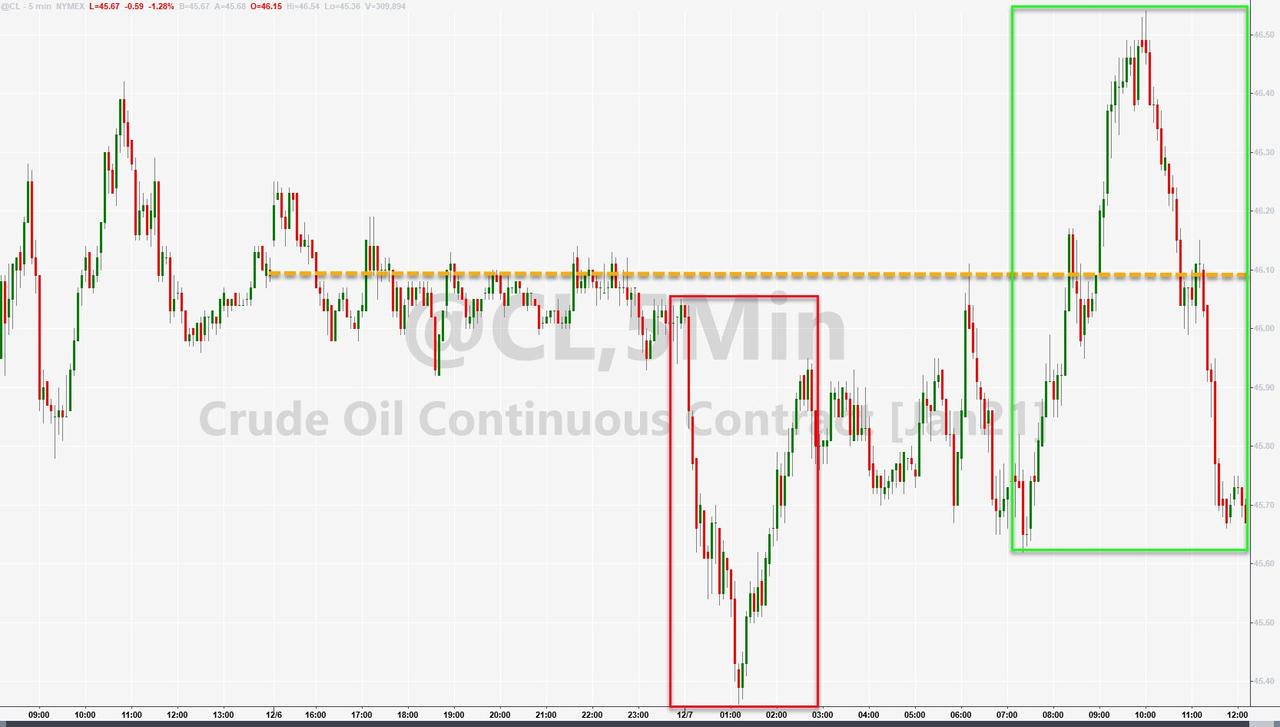
After their recent magnificent squeeze higher, Energy stocks were clubbed like a baby seal today as health officials warned of the darkest winter in the history of dark winters (or some such scary bullshit)...
See Chart:
https://www.zerohedge.com/s3/files/inline-images/bfm5607.jpg?itok=RAMjXca0
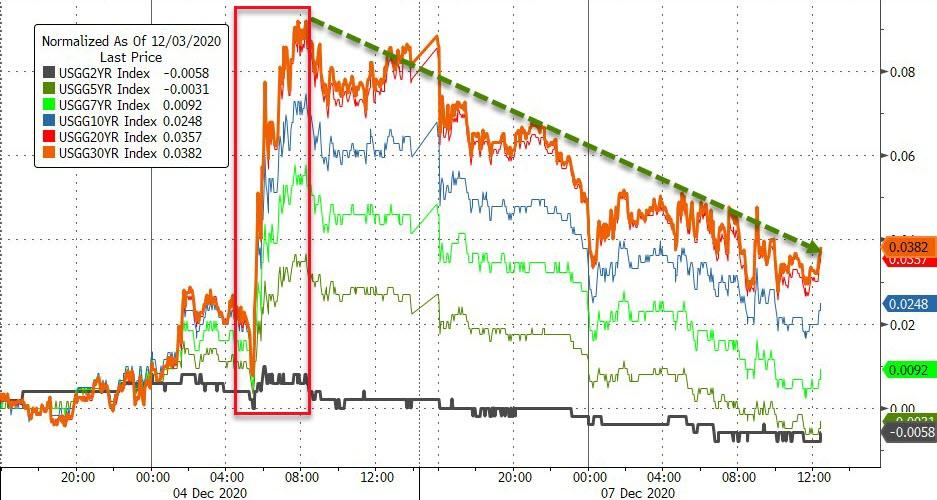
Bonds were bid on the day...
See Chart:
https://www.zerohedge.com/s3/files/inline-images/bfmFAE4.jpg?itok=m6_wbGk5
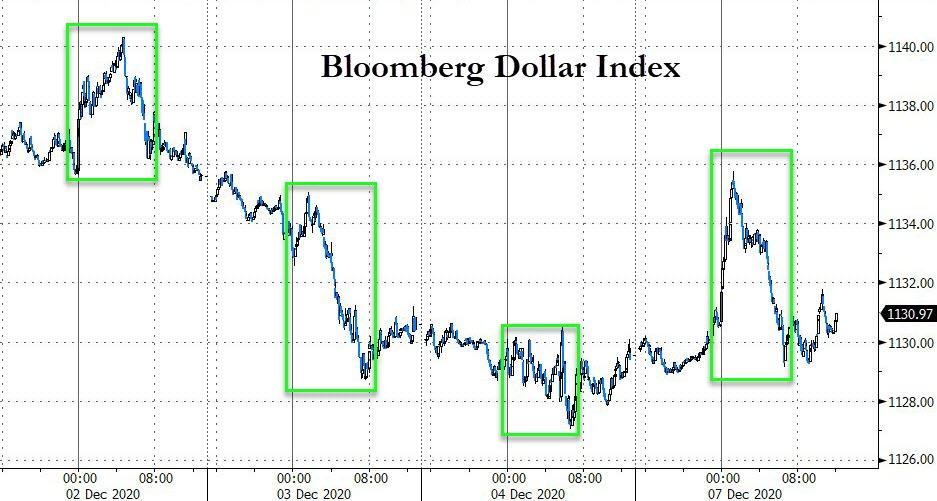
The dollar ended the day modestly higher but well off its overnight highs (seemingly seeing a bid during the Asian market session and offered during Europe's)...
See Chart:
Bloomberg Dollar Index
https://www.zerohedge.com/s3/files/inline-images/bfm3E8.jpg?itok=N8rJnlf1
Oil prices saw two big moves intraday but ended lower with WTI back below $46...
See Chart:
https://www.zerohedge.com/s3/files/inline-images/2020-12-07_12-08-14.jpg?itok=-tflbZjh
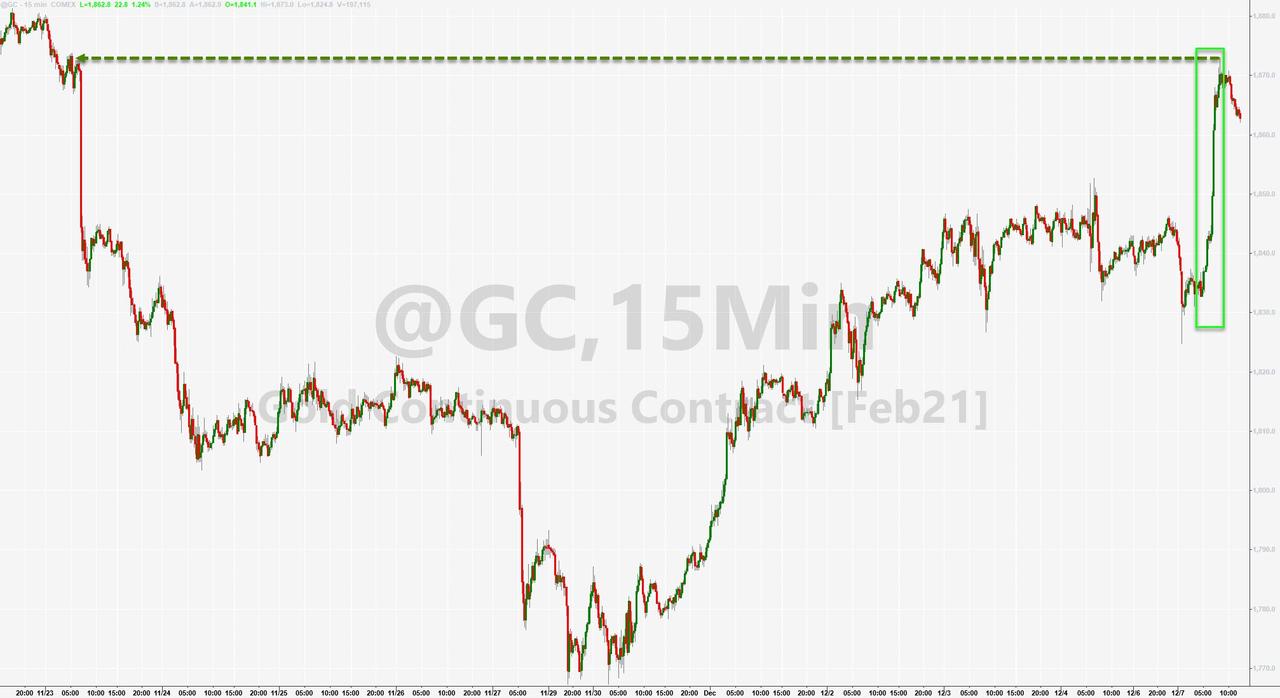
Gold and Silver outperformed today...
See Chart:
https://www.zerohedge.com/s3/files/inline-images/2020-12-07_12-05-26.jpg?itok=OJ9VepCP
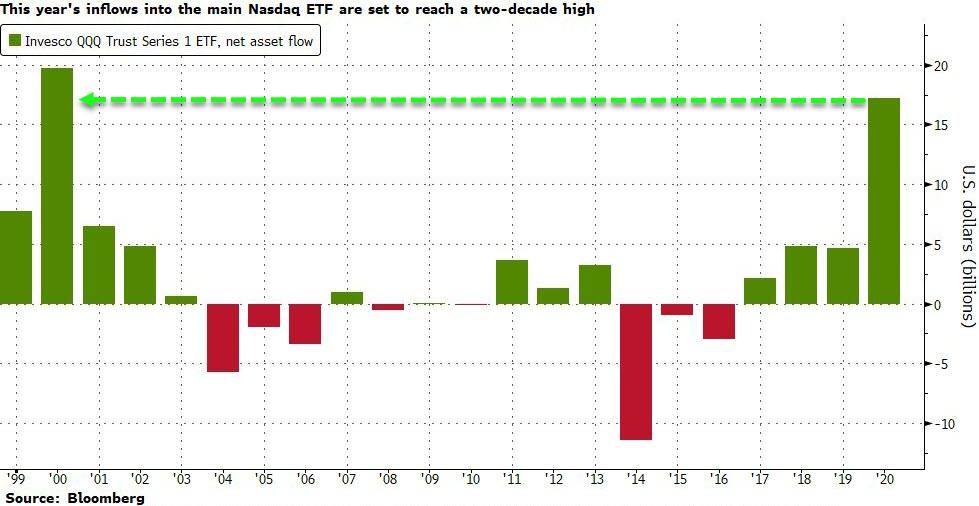
Finally, this is probably nothing...
See Chart:
https://www.zerohedge.com/s3/files/inline-images/bfmB95A.jpg?itok=jsJiVTVr
As Bloomberg's Jan-Patrick Barnert writes, with an eye-watering 43% rally this year, the Nasdaq 100 Index is among the world’s best-performing gauges amid the pandemic. During the period, investors have poured more money into the largest exchange-traded fund tracking the index than in any year since the height of the dotcom era. The Invesco QQQ Trust Series 1 ETF has logged $17.2 billion of net inflows to date, not far off the $19.7 billion record set in 2000.
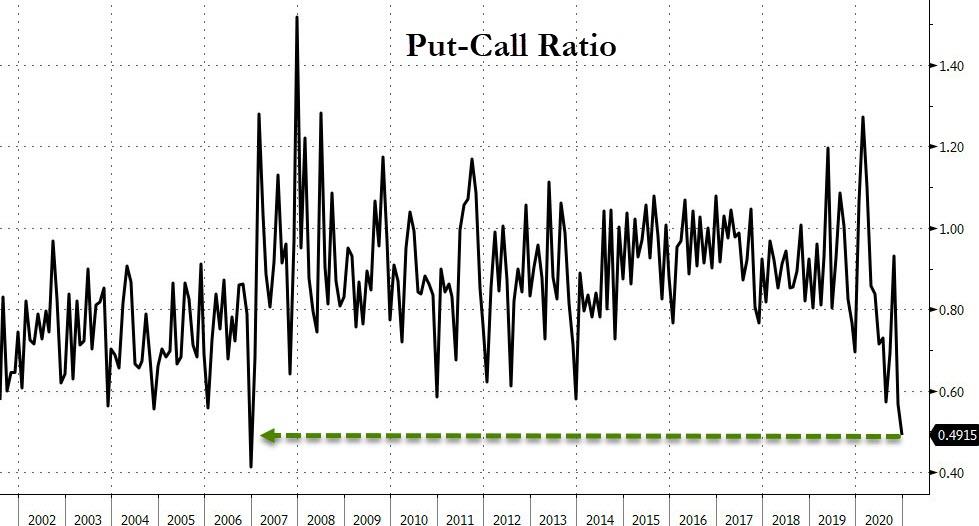
Still, at least they are buying some protection after those massive gains... oh wait!?
See Chart:
Put-Call Ratio
https://www.zerohedge.com/s3/files/inline-images/bfm802B.jpg?itok=kIsWLTiT
What could go wrong?
….
SOURCE: https://www.zerohedge.com/markets/bonds-bullion-bid-stocks-skid-stimulusvaccine-stumble
----
----
by Tyler Durden
"We should be expecting more bankruptcies going forward yet credit spreads are quite low by historical standards, and indeed while banks are pricing risk more carefully we don’t see the same in capital markets."
There are three certainties in life: death, taxes and the BIS - the central banks' central bank - warning about excesses from monetary policy (the most recent amusing example of this was last October when as we wrote, "Fed Announces QE4 One Day After BIS Warns QE Has Broken The Market"). Actually, to this list of 3 certainties we can add one more: central banks roundly ignoring the warnings from the central bank mothership.
That, however, does not prevent the BIS from continuing this trend of warnings, and today the Basel-based organization did just that when in its Quarterly Review publication it cautioned that the surge in financial markets following COVID-19 vaccine breakthroughs and the U.S. election has left asset prices increasingly stretched.
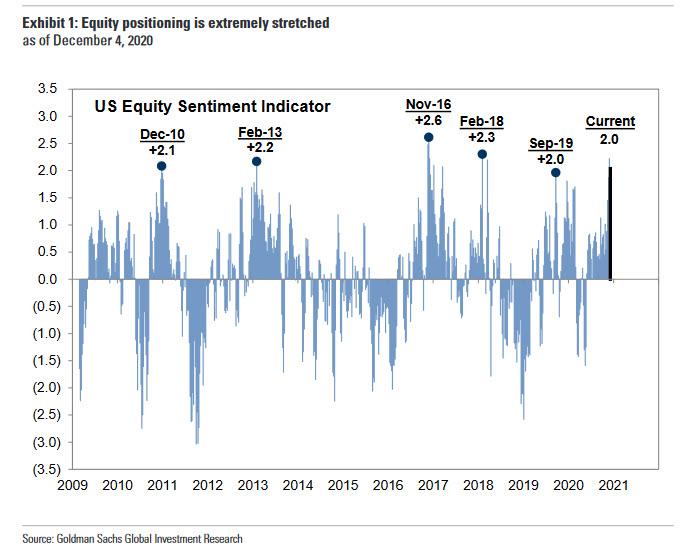
Sounding surprisingly similar to Goldman, which as we reported earlier today issued an almost identical warning, when it observed that its sentiment indicator is now +2.0 standard deviations above average...
See Chart:
Equity positioning is extremely stretched
https://www.zerohedge.com/s3/files/inline-images/positioning%20stretched_0.jpg?itok=ls5HNeCU
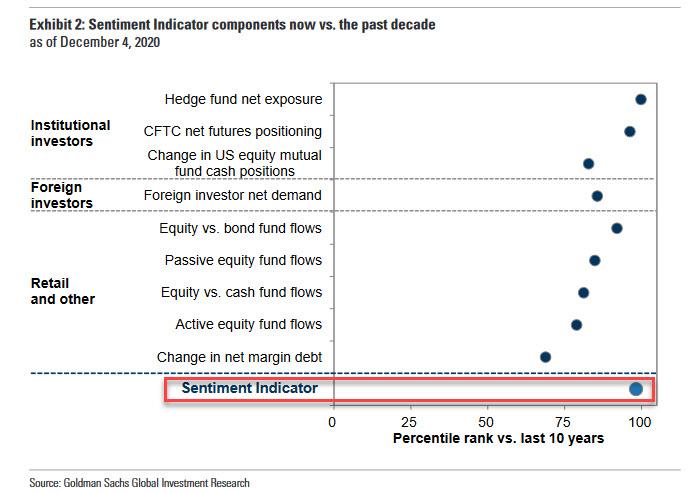
... which has left positioning extremely stretched and represents a 98th percentile reading since 2009...
See Chart:
https://www.zerohedge.com/s3/files/inline-images/sentiment%20indicator%2098_1.jpg?itok=XODzeDSp
Borio said one of the developments it was particularly wary of was the rapid easing of stress in corporate credit markets, which recently culminated in record low junk bond yields, a paradox considering that corporate leverage hit record highs, yet perfectly understandable in light of the Fed's backstop of the entire corporate bond market.
See Chart:
And in a dire warning that got virtually no airplay today, Borio made the following stunning announcement to reporters. "We are moving from the liquidity to the solvency phase of the crisis."
Translation: it's about to get much worse, only because central banks will ignore all the warnings, they will double down on the same failed policies, pushing leverage to even record-er highs, yields to even record-er lows, and sparking a propagation of zombies the likes of which have never before been seen.
"We should be expecting more bankruptcies going forward yet credit spreads are quite low by historical standards, and indeed while banks are pricing risk more carefully we don’t see the same in capital markets."
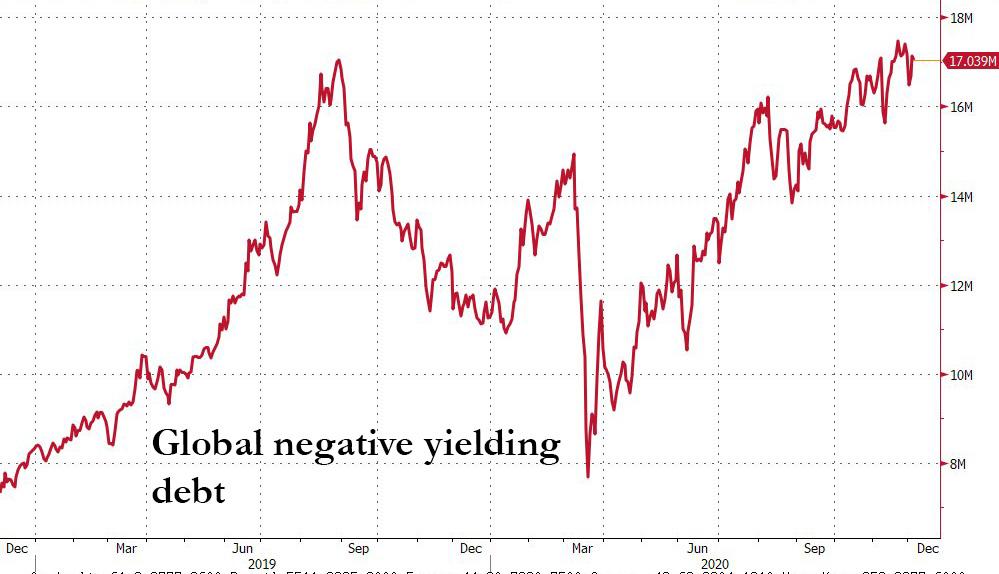
One almost sensed the futility in Borio's comments when he said that with $17.5 trillion worth of bonds now carrying negative yields many money managers were being pushed into riskier and riskier assets.
See Chart:
Global Negative Yielding Debt
Well, WHOSE FAULT IS THAT MR CHIEF HEAD OF THE MONETARY DEPARTMENT AT THE CENTRAL BANKS' CENTRAL BANK?
Of course, Bortio wouldn't bring himself to admitting that the very same central banks he is "supposed" to advise are ignoring his warnings and recommendations - and are instead flooding the market with trillions in stimulus which does not flow into the economy but merely makes asset holders richer beyond their wildest imagination - as that would mean that someone, clearly not the BIS, is now in charge of monetary and economic advice at central banks.
Which also means that the BIS is no longer relevant, having been upstaged by its constituent members.
In his parting words absolution to the helicopter money insanity that has taken over, Borio had no choice but to admit that - despite his misgivings - he has to side with the central banks: "The outlook is rather uncertain and you would rather err on the side of doing too much as opposed to doing too little."
Brilliant... just ignore that the entire world is now on the verge of a financial cliff where the next crash will not only wipe away hundreds of trillions in wealth and destroy confidence in central banks and fiat money, but abolish the voodoo "science" that is modern economics that keeps people like Borio employed.
It will be for the best.
….
----
----
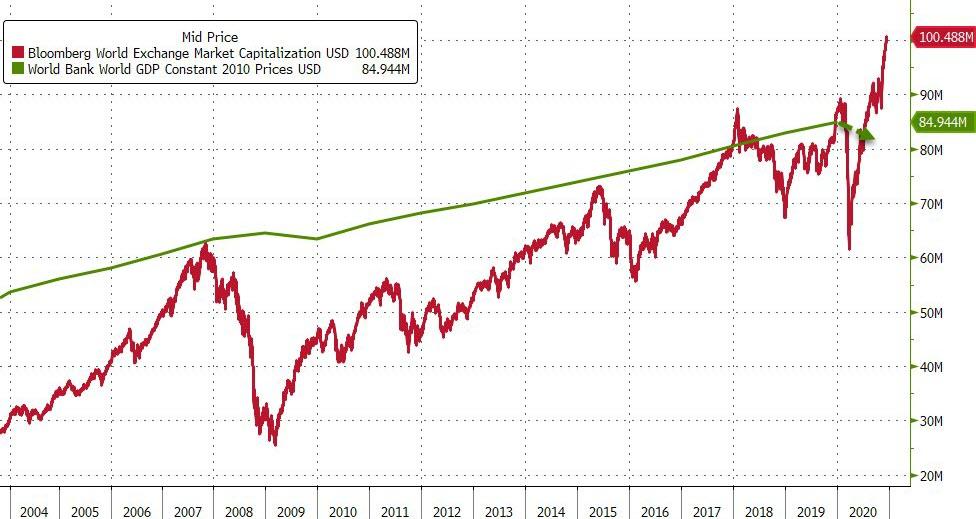
"MORE DANGEROUS THAN YOU THINK" - GLOBAL STOCK MARKET CAP TOPS $100 TRILLION FOR FIRST TIME EVER
Risk builds slowly and happens fast...
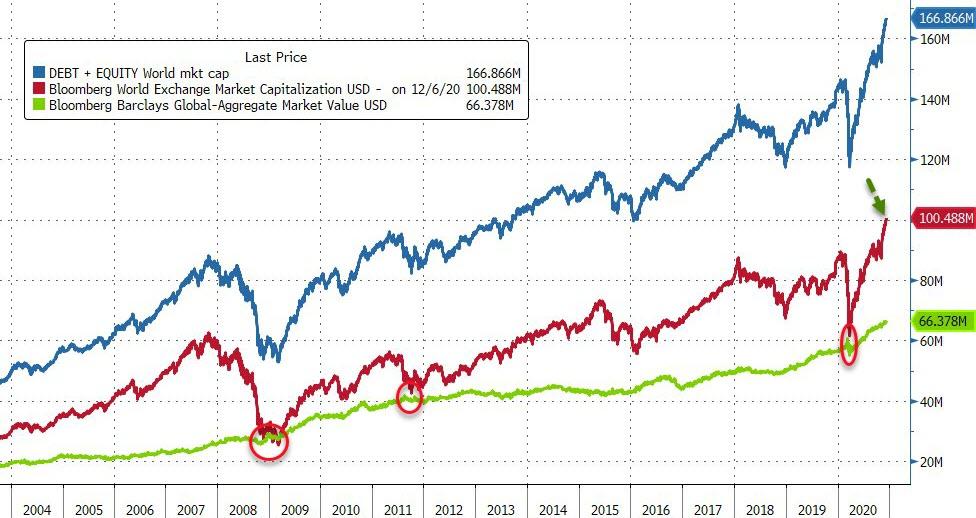
One hundred trillion dollars... that's a 1 followed by 14 zeros! That is the current market capitalization of global stock markets - a level never before seen in history.
See Chart:
https://www.zerohedge.com/s3/files/inline-images/bfmFA25.jpg?itok=v3qbYfJe
Remember when $100,000,000,000,000 was a lot of money? For some context, World GDP was around $85 trillion at the end of 2019 (and as stock market values have soared in 2020, GDP has not)...
See Chart:
https://www.zerohedge.com/s3/files/inline-images/bfm88E8.jpg?itok=S3JxUsj4
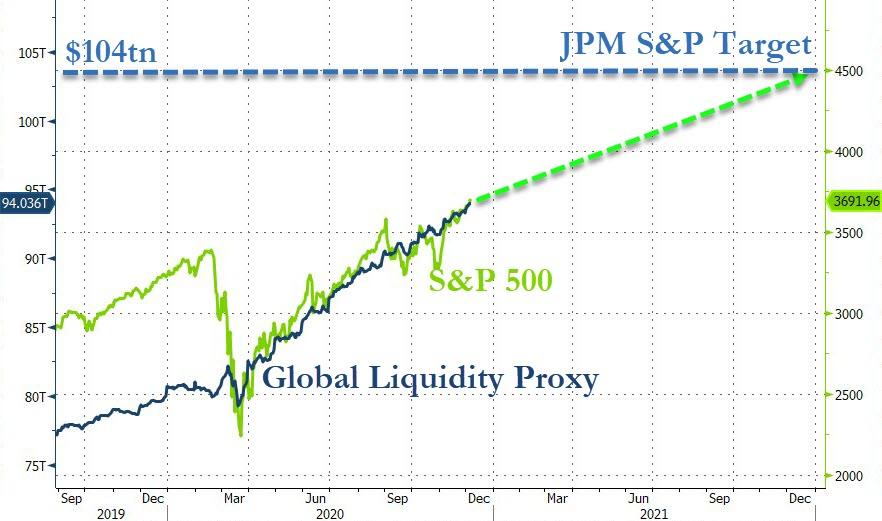
Interestingly, the global bond market's value also reached a record high at over $66 trillion, meaning that $14 trillion in global liquidity added since the March crash lows has lifted global bond and stock markets by a stunning $50 trillion ($40 trillion or so in stock and $10 trillion or so in bonds).
And judging by the smorgasbord of strategist forecasts for 2021, there is no stopping this surge (until of course, it all goes full Thelma-and-Louise and confidence in global fiat collapses).
JPMorgan sees the S&P 500 at 4,500 by the end of 2021, which, if 2020 is anything to go by, means an additional $10 trillion in global liquidity will be required to inflate the index's value...
See Chart:
https://www.zerohedge.com/s3/files/inline-images/bfm72C.jpg?itok=zv-P25OL
Which is ironic since, as Daniel Lacalle detailed earlier, also according to JP Morgan, equity markets have not been this expensive so early into an economic recovery phase in the last twenty years.
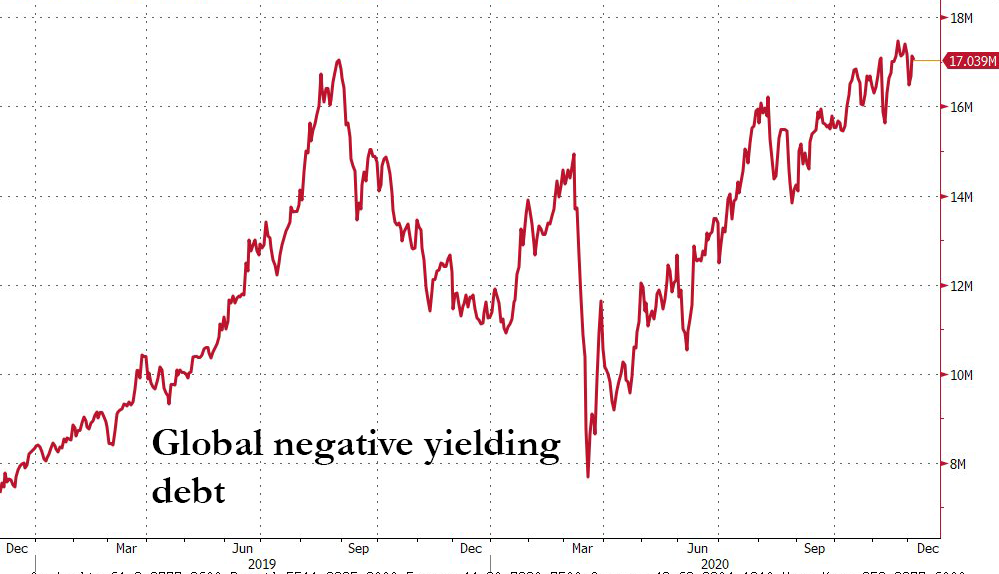
The Greed vs Fear Index also shows extreme optimism, while the Call to Put ratio in derivatives, that reflects the derivative exposure to a rising market, is also at multi-year highs. Meanwhile, the amount of negative-yielding bonds globally has risen to almost $18 trillion...
See Chart:
https://www.zerohedge.com/s3/files/inline-images/2020-12-07%20%281%29.png?itok=Sv8bM-42
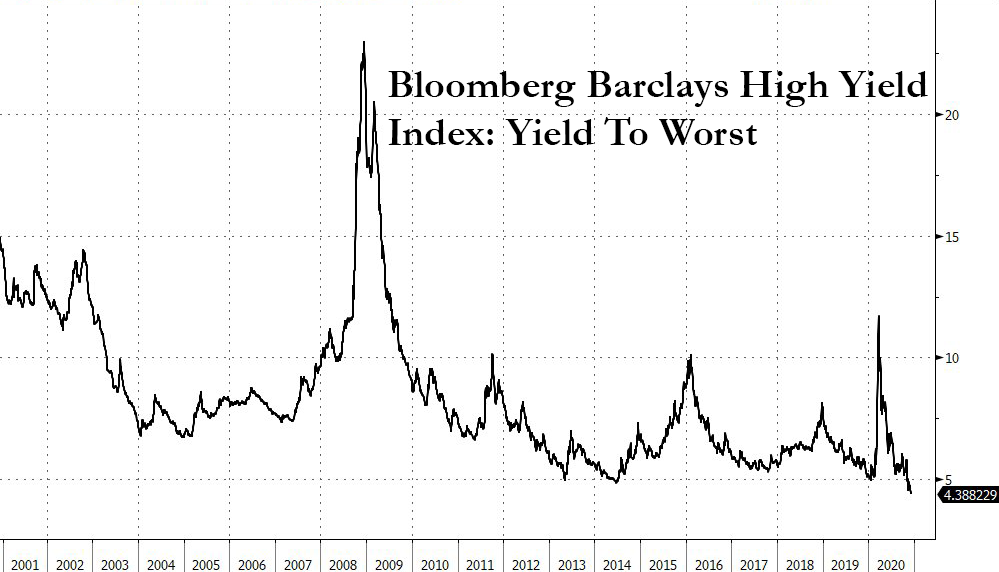
..and the High Yield Index has risen to pre-crisis levels (and spreads to record lows).
See Chart:
Bloomberg Barkclays High Yield Index: Yield to worse
https://www.zerohedge.com/s3/files/inline-images/2020-12-07.png?itok=P8QJH1Zq
Many factors explain this level of optimism in markets. The news about vaccines and estimates of a rapid economic recovery accelerated investors’ bullish bets.
However, we must remember that all consensus estimates for 2021 already discounted the end of the pandemic, and that the quick recovery so many hoped for is not happening, and definitely not in a way that would justify the aggressive increase in risk.
Recent macroeconomic figures have not added hopes for a stronger recovery.
So why are markets so bullish? Central banks play a major role in this risk-taking frenzy. The balance sheet of the major central banks has soared to more than $20 trillion, the ECB balance sheet is now more than 61% of the GDP of the eurozone and the Federal Reserve exceeds 34%. Many market participants are using an often-repeated “Bad Is Good” strategy. A large number of investors ignore macro and debt data and increase bullish bets assuming that if figures remain weak, central banks will increase their stimulus plans.
Why is this dangerous?
Central banks’ ignore the excessive market valuations and risk of asset bubbles created by their “expansionary” policies because they see these as small collateral damages of a wider and more important impact on the economy. As long as headline and core inflation in their economies remains weak or below target, they do not see any risk. But there are plenty.
The first risk is creating a debt and banking crisis.
The second risk is ignoring inflationary pressures on the goods and services citizens really use.
The third risk is to create a perverse incentive in investors that fuels bubbles that create relevant ripple effects in the real economy when they burst.
Some investors may know that they are taking too much risk, but a large part also thinks that risk is gone because central banks will continue to implement stimuli, and this is really problematic. Too much debt and too much risk are not irrelevant factors, they mean lower growth, weaker productivity and higher probability of a crash in a few months. We have seen it in 2018, now in 2020.
Risk builds slowly and happens fast. Central banks cannot continue to ignore the insanity of sovereign bond valuations and the risk of concentration in markets. Low inflation is not an excuse to implement wrong policies even more aggressively.
The solution to wrong policies is not to implement more of them. The world needs to stop this insane downward spiral of debt and constant bubble booms and busts.
….
SOURCE: https://www.zerohedge.com/markets/expensive-markets-are-more-dangerous-you-think
----
----
THE "ROARING 20S" – THE FUNDAMENTAL PROBLEM OF THE BULLISH VIEW
Authored by Lance Roberts via RealInvestmentAdvice.com, MUST READ
...while stock prices can be lofted higher by further monetary tinkering, the underlying fundamentals are inverted. The larger problem remains the economic variables’ inability to “replay the tape” of the ’20s, the ’50s, or the ’80s...
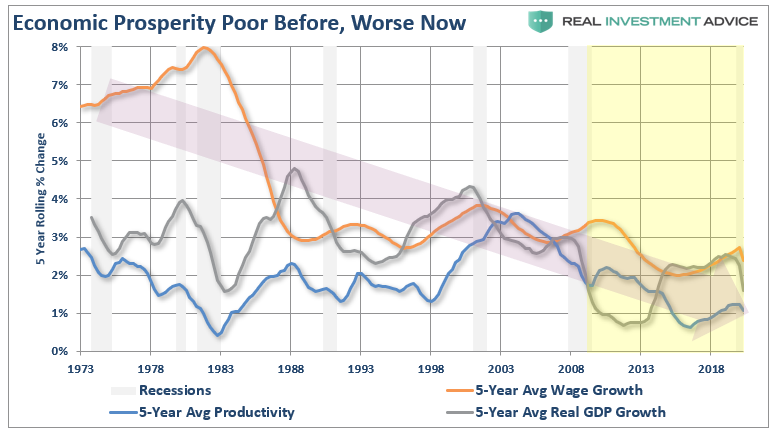
The use of technology today reduces the demand for physical labor by increasing workers’ efficiencies. Since the turn of the century, technology has continued to suppress productivity, wages, and, subsequently, the rate of economic growth.
Technologies Dark Side
Such was a point we made in “The Rescues Are Ruining Capitalism.”
“However, these policies have all but failed to this point. From ‘cash for clunkers’ to ‘Quantitative Easing,’ economic prosperity worsened. Pulling forward future consumption, or inflating asset markets, exacerbated an artificial wealth effect. Such led to decreased savings rather than productive investments.”
See Chart:
Economic prosperity: poor before, worse now
The critical distinction between the technology of the ’20s and today is stark.
When technology increases productivity and output while simultaneously increasing demand by increasing “reach,” it is beneficial.
However, when technology improves efficiencies to offset weaker demand and reduce labor and costs, it is not.
Given the maturity of the U.S. economy and the ongoing drive for profitability by corporations, technology will continue to provide a headwind to economic prosperity.
The Fundamental Problem Of Debt
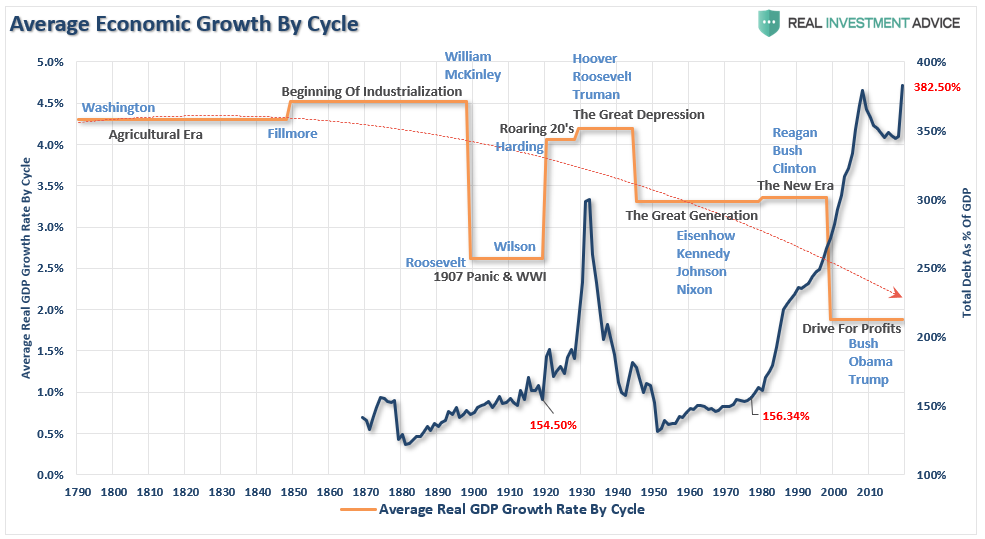
Another difference is the level of debt. One of the fundamental requirements for creating strong economic growth rates is low levels of leverage. In the 1920s, consumers had very little, if any, debt. Such was also the case with Government debt. Such allowed higher economic growth rates and overall prosperity as incomes did not get diverted to service debt.
At the beginning of the “Roaring 20s,” total credit market debt to GDP was 154%. Such was also about the same level of debt-to-GDP when we entered into the “Roaring 80’s” bull market.
See Chart:
Average Economic Growth by Cycle
https://www.zerohedge.com/s3/files/inline-images/image_2020-11-25_155524.png?itok=I5i_w8fP
Importantly, when talking about “bull markets,” the amount of debt in the system plays an essential factor. The last time that debt-to-GDP ratios hit such a peak was going into the “Great Depression.” Not the beginning of the “Roaring 20s.”
The Fundamental Problem Of Economic Growth
Since debt retards economic growth by diverting savings into debt payments rather than productive investments, such also provides a significant headwind to Ed’s “Roaring 20s” aspirations.
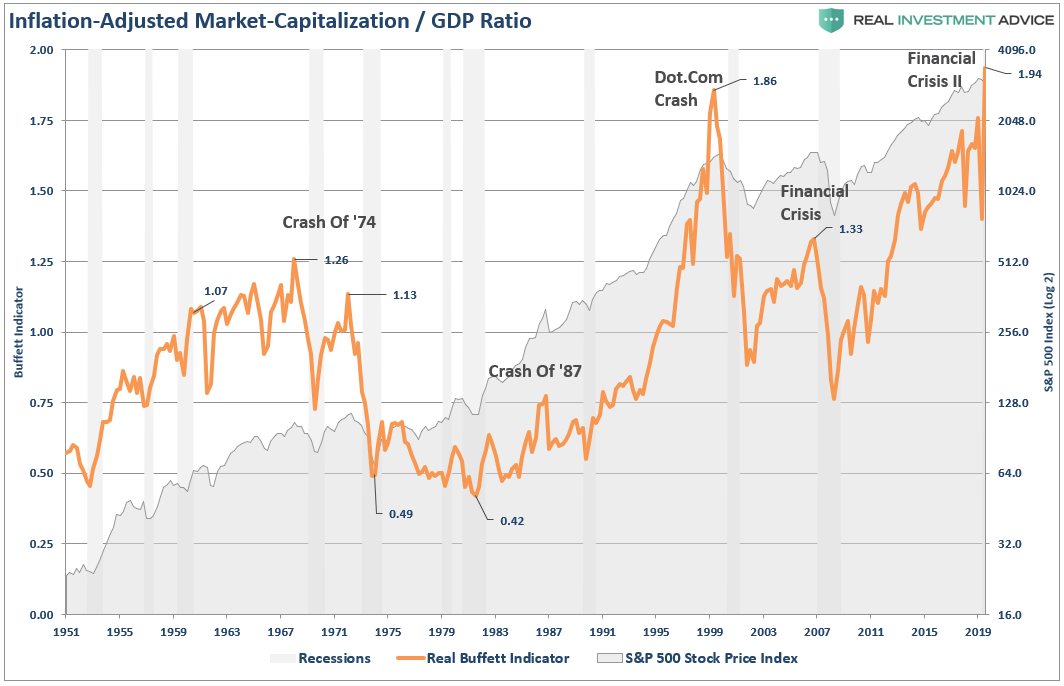
The current deviation between the market and underlying economic growth is the largest in history. Given the high correlation between the economy, corporate profits, and stock prices over the long-term, the “Market Capitalization” to “Gross Domestic Product” ratio tells us much.
See Chart:
Inflation-adjusted Market-Capitalization/ GDP ratio
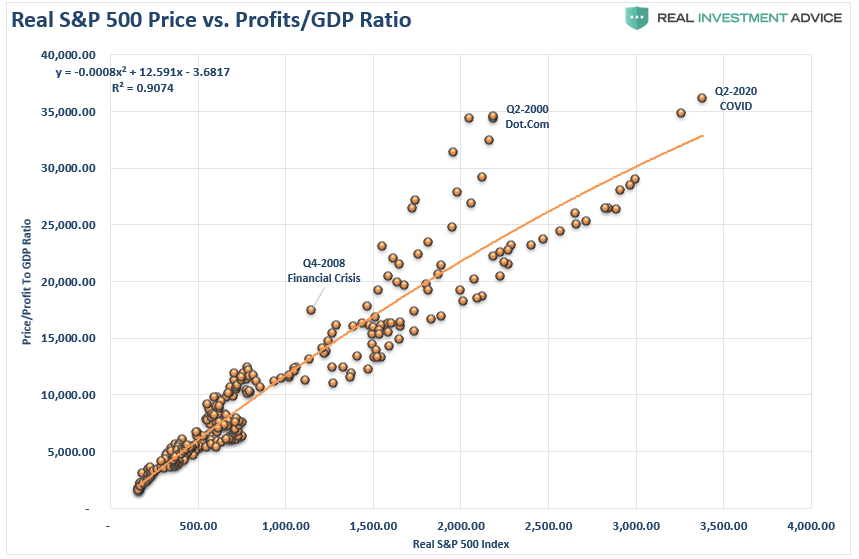
The indicator shows us that when “disconnects” between market participants and the underlying economy occur, a reversion ensues. The correlation is more evident when looking at the market versus the ratio of corporate profits to GDP. With a 90% correlation, investors should not dismiss these deviations.
See Chart:
Real S&P 500 prices vs. Profits /GDP ratio
CONTEXT IS CRITICAL.
Those low valuations, and subsequent market surge, followed a nearly 20-year long bear market in stock prices. Such was due to a banking crisis in 1907, WWI, and a rarely discussed “economic depression” heading into 1920. Low valuations, combined with a depressed economy, lead to a massive recovery driven by sharply higher economic growth over the next 9-years.
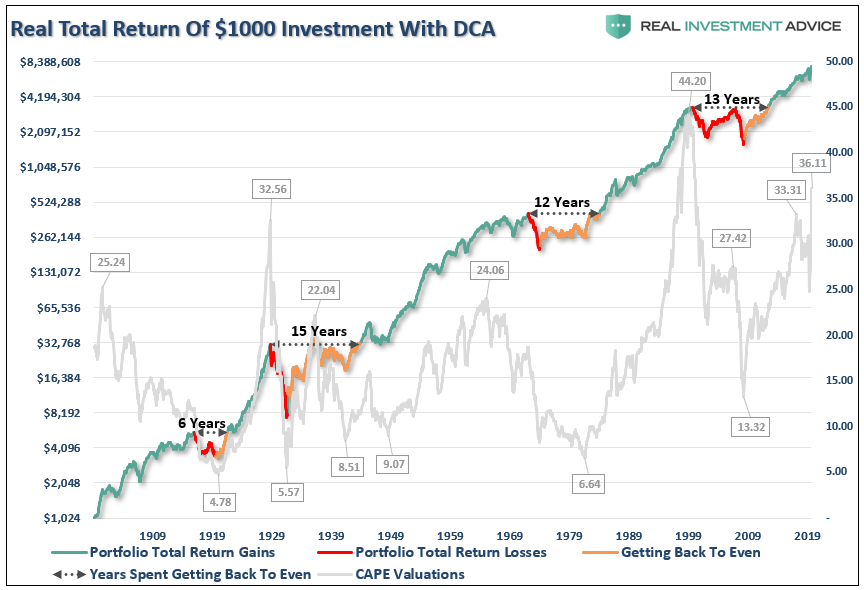
Such is hardly the case today. After an 11-year expansion, extreme leverage of the financial and economic systems, and valuations elevated, support for a 20’s melt-up is limited. As shown below, such periods have not coincided with a subsequent decade of “roaring asset prices,” but rather a disappointment.
See Chart:
Real total return of $1000 investment with DCA
https://www.zerohedge.com/s3/files/inline-images/image_2020-11-25_163158.png?itok=Pa4f2LiO
CONCLUSION:
Today, while stock prices can be lofted higher by further monetary tinkering, the underlying fundamentals are inverted. The larger problem remains the economic variables’ inability to “replay the tape” of the ’20s, the ’50s, or the ’80s. At some point, the markets and the economy will have to process a “reset” to rebalance the financial equation.
In all likelihood, it is precisely that reversion which will create the “set up” necessary to begin the “next great secular bull market.” Unfortunately, as was seen at the bottom of the market in 1974, there will be few individual investors left to enjoy the beginning of that ride.
READ THE WHOLE ART & SEEMORE CHARTS AT:
SOURCE: https://www.zerohedge.com/markets/roaring-20s-fundamental-problem-bullish-view
----
----
US DOMESTIC POLITICS
Seudo democ duopolico in US is obsolete; it’s full of frauds & corruption. Urge cambio
MODERNA, PFIZER CEOS SKIP WHITE HOUSE COVID VACCINE SUMMIT AFTER LEAKING DATA TO BIDEN
They're trying to stop President Trump from taking credit for "Operation Warp Speed's" success.
More than a month later, after Nov 3, Pfizer and Moderna have revealed that they remain in close contact with the Biden team. As it turns out, Biden may have been briefed on the initial Pfizer and Moderna data before President Trump, even though, at that point, Biden's victory had been decided by the media, and the media alone, STAT News reports.
Now, both Pfizer and Moderna are skipping a White House vaccine summit, despite taking billions in taxpayer dollars for their vaccines. Unlike Moderna, which benefited directly from "Operation Warp Speed" funds, Pfizer self-financed the development of the vaccine, before striking a deal with OWS to supply the US with millions of doses.
Both companies, and their executives, have benefited from these Trump Administration programs. But now, it seems, they're trying to send a message to the public: The Trump Administration doesn't deserve credit for the vaccines.
And the Democrats complain that Trump has been "sabotaging" the transition - yet, executives tacitly aligned with his political opponents won't even deign to meet with the president and his team.
====
HOUSE EXPECTED TO VOTE WEDNESDAY ON STOPGAP BILL TO AVOID GOVT SHUTDOWN
...implicitly recognizing the fact that any COVID Relief is not imminent.
====
THE FEDERALIST DESTROYS ATTEMPTED DEBUNKING OF LATE-NIGHT BALLOT MALARKEY IN GEORGIA
They aren't sending their best...
====
"DON'T NEED CONGRESS - JUST FLICK OF PEN": SCHUMER DEMANDS DAY 1 BIDEN $50K STUDENT DEBT CANCELATION
Poof like magic...
====
PETER SCHIFF: THE FED IS FIGHTING FIRE WITH FIRE
"I think it’s going to finish out the year particularly weak and it is going lead to an even weaker 2021, which I think could be the weakest year ever for the US dollar..."
====
WHO WEIGHS ETHICS OF DELIBERATELY INFECTING PATIENTS WITH COVID-19 TO TEST VACCINE EFFICACY
Remember that time CNBC's Rick Santelli caused a media firestorm by (half-seriously) suggesting that people should infect themselves with SARS-CoV-2 to try and blunt the economic fallout?
====
US-WORLD ISSUES (Geo Econ, Geo Pol & global Wars)
Global depression is on…China, RU, Iran search for State socialis+K-, D rest in limbo
BANK OF JAPAN IS NOW THE BIGGEST OWNER OF JAPANESE STOCKS WITH $434 BILLION PORTFOLIO
The combination of "a state-run institution, the BOJ, and the country’s representative public pension fund, the GPIF, buying up local equities feels distorted."
====
US DESIGNATES 14 MORE CHINESE OFFICIALS IN LATEST HONG KONG SANCTIONS
The sanctions stopped short of taking aim at one of the most senior officials
====
A BIZARRE DISCREPANCY EMERGES IN THE TRADE DATA BETWEEN US AND CHINA
Historically, it has always been the case that the US data for imports from China showed more imports than the Chinese data showed exports to the United States. That relationship has now flipped.
In short, after the US made some headway in its trade war with Beijing, all that progress and more is now gone as Chinese net exports are steamrolling ahead... thanks to covid.
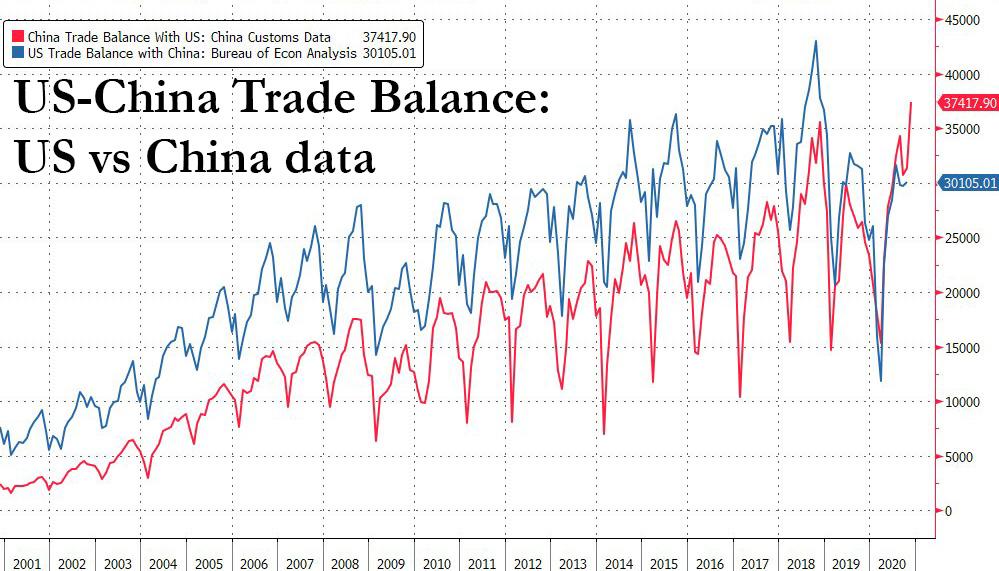
Yet here an interesting observation emerges: while the trade surplus with the US according to China Customs data indeed hit a record high, US Bureau of Economic Analysis data shows something quite different, and this discepancy is show in the chart below.
See Chart:
US-China Trade Balance: US vs. China Data
https://www.zerohedge.com/s3/files/inline-images/US%20china%20trade%20data.jpg?itok=KlbSHb2s
This is, to say the least, strange: after all data is data, and when one using the same nominal amount of trade exports and imports between the two countries engaging in trade, one should - in theory at least - end up with the same trade surplus (and respectively deficit) number.
Alas, as the chart above shows, not only has that has not been the case for the past two decades, but curiously, after years of US data showing a larger bilateral deficit with China than the Chinese data shows a surplus with the United States (largely due to the so-called Hong Kong port effect which explains much of the discrepancy), this has reversed in the past few months when China’s reported exports to the United States have significantly exceeded reported U.S. imports (the exact opposite of the established pattern). This can be seen clearly in the chart below which is a zoomed in portion the bilateral trade balances shown above:
See Chart:
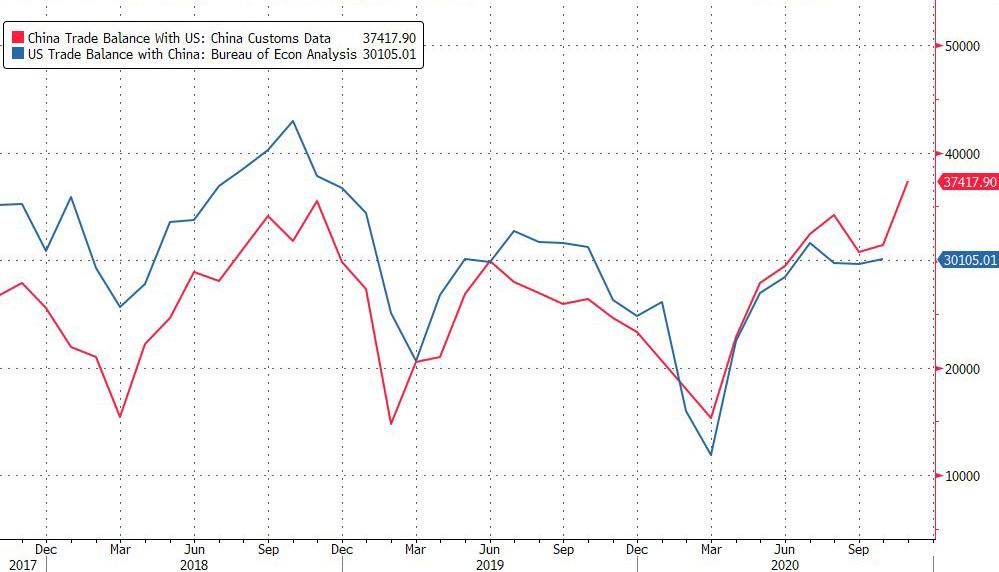
This phenomenon which has escalated drastically in recent months, was first pointed out by former Treasury official Brad Setser who pointed out the data discrepancy in an October blog post , writing that "there is no doubt there is a gap. In July 2018, China said it exported $41.6 billion to the United States, and the United States reported importing $47 billion from China. In July 2019, China said it exported $38.9 billion to the United States (down because of the tariffs), and the United States reported importing $41.4 billion from China. And in July 2020, China said it exported $43.7 billion to the United States, while the United States only reported importing $40.7 billion from China."
As a result, as Setser adds, "the answer to a lot of politically-salient questions—for example, is the bilateral trade deficit with China larger or smaller now than in 2016?—hinges on whether you use the U.S. or the Chinese data. "
If you look at the Chinese data, its current monthly surplus with the United States is at an all-time high for the months of July and August, topping its pre-trade war peaks by substantial margins
In the U.S. data, the July deficit with China and Hong Kong (adding in Hong Kong reduces the size of the deficit as the United States runs a surplus with HK) is only just above its 2016 levels.
Fast-forwarding two months to the latest December data only shows that this divergence has accelerated with the latest Chinese data showing yet another record surplus for the month of November.
To be sure, and as one can easily see in the charts above, the gap between China’s reported exports to the United States - red line - and reported U.S. imports - blue line - plus the larger deficit when reported from the U.S. side than the surplus on the Chinese side, has been a long-standing pattern. It reflects the previously discussed role of Hong Kong in U.S.-China trade, because as Setser explains, "a lot of what China records in its data as an export to Hong Kong historically has ended up in the U.S. data as an import from China, and a lot of what the United States reports as an export to Hong Kong has historically ended up in the Chinese data as an import from the United States."
What is novel here is the change in the pattern - the long established and well-understood discrepancy between the import and export side data has gone away.
The puzzle, as Setser wrote, "is why the sign on the discrepancy looks to be flipping." There are two possible explanations which immediately come to mind.
Chinese exporters might be overstating their exports, in general and to the United States. Overstating exports is a classic way of getting capital into a country with capital controls.
However, a simpler explanation is that the US tariffs have created a strong incentive for firms importing into the United States to go to some lengths to understate their imports from China. Thus, U.S. imports from China are now likely under-counted (which by implication holds the bilateral trade deficit down).
As Setser concludes, we are confident that economists looking at the growing discrepancy in trade data between the US and China will soon be busy coming up with their own theories, even if the real answer why this most critical trade relationship in a world where the US-China trade war has been the overriding theme for much of the past 4 years, will likely remain a mystery.
….
SOURCE: https://www.zerohedge.com/markets/bizarre-discrepancy-emerges-trade-data-between-us-and-china
----
----
SPUTNIK and RT SHOWS
GEO-POL n GEO-ECO ..Focus on neoliberal expansion via wars & danger of WW3
US Presidential Elec: last update: https://sputniknews.com/us/202011031080967036-2020-us-presidential-election/
-Third Recount of Georgia Ballots Confirms Biden Won Election in Battleground State
- Power Will Transfer Peacefully From Trump to Biden, WH Adviser Kudlow Says
- Russia's Su-30 Intercepts US, French Spy Planes Over Black Sea
- Canadian Intellig Says Covid Conspiracies May Spark Spate of Attacks on 5G Sites
- Chinese Flag and Soil Samples: Chang'e 5 Completes Lunar Orbit Docking
- Venezuela National Assembly Elections: Socialist Alliance Celebrates Victory
- Yesterday’s Man Pompeo Labelled a 'Zombie' – Venezuela Continues to Defy
- Mexican President Reportedly Proposes to Restrict US Agents in Mexico
- NATO Craving Conflict by Finian Cunningham
- Lukashenko Unveils ‘Beautiful Democ’ Plan for Redistribu of Polit Power in Belarus
- Meritocracy or Technocracy? Meet Biden's Top Health Team to Oversee CV Respons
- US Designates 14 Chinese Officials in New Sanctions Over Hong Kong
- US Federal Judge Upholds Election Results in Michigan, Court Order Says
- To the Future: How Digital Technology Changes Education
- Goldman Sachs Reportedly Weighing Partial Exodus From the Big Apple
- Boris Johnson's 'No Deal' Brexit As Likely Now As Before, But All is Not Lost
- Head of Russian Observer Mission Says Venezuela Got Legitimate Parliament
- China to Launch Digital Yuan ‘Giveaway’ in Massive On-the-Ground Trial Of 'Cashless' Payment System more than 2 billion yuan ($300 million) have already taken place.
- As UK-EU Negotiate on Brexit, How Many Ultimat Have There Been Since the Refer
- Man of Botched Venezuela Raid Praises Assange, Snowden, Says FBI Tried to Kill Him
- Court in Istanbul Releases Russia's NTV Reporters, They Will Be Deported.
- Foreigners Master Big Data, Blockchain, Other Tech in Russia
- Seventeen volunteer Indians Receive First Dose of Russian Vaccine Sputnik V
- What Are d Three 'Sticking Points' Blocking London-Brussels Post-Brexit Trade Talks?
====
====
No hay comentarios:
Publicar un comentario